

Understanding the difference between flows and stock in crop land, for instance,
what is the natural capital in stock form that allows the growing of crops, and how to
account for it, may address the problem of quality loss of the soil and the sustainability of management practices. A similar rationale may be applied to other land
types, in consideration also of deforestation, the collapse of fisheries, and accumulation of CO 2 in the atmosphere.
1.3.1 Equations
The way that the Ecological Footprint is calculated is based on the GAEZ (Global
Agro-Ecological Zones) model that ascribes a level of productivity to different
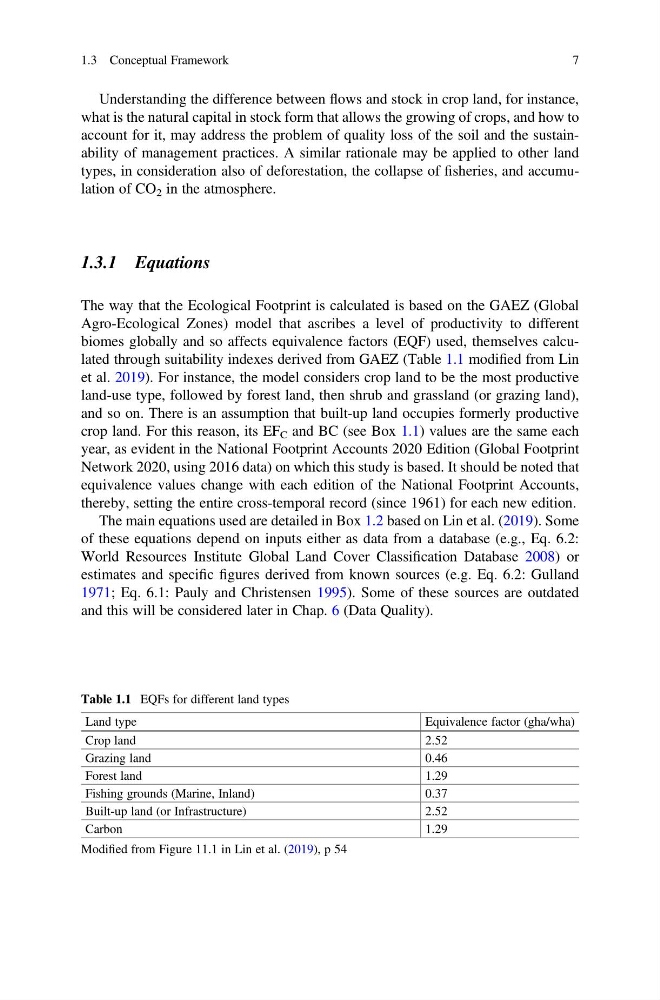
biomes globally and so affects equivalence factors (EQF) used, themselves calculated through suitability indexes derived from GAEZ (Table 1.1 modified from Lin
et al. 2019). For instance, the model considers crop land to be the most productive
land-use type, followed by forest land, then shrub and grassland (or grazing land),
and so on. There is an assumption that built-up land occupies formerly productive
crop land. For this reason, its EF C and BC (see Box 1.1) values are the same each
year, as evident in the National Footprint Accounts 2020 Edition (Global Footprint
Network 2020, using 2016 data) on which this study is based. It should be noted that
equivalence values change with each edition of the National Footprint Accounts,
thereby, setting the entire cross-temporal record (since 1961) for each new edition.
The main equations used are detailed in Box 1.2 based on Lin et al. (2019). Some
of these equations depend on inputs either as data from a database (e.g., Eq. 6.2:
World Resources Institute Global Land Cover Classification Database 2008) or
estimates and specific figures derived from known sources (e.g. Eq. 6.2: Gulland
1971; Eq. 6.1: Pauly and Christensen 1995). Some of these sources are outdated
and this will be considered later in Chap. 6 (Data Quality).
Table 1.1 EQFs for different land types
Land type
Equivalence factor (gha/wha)
Crop land
2.52
Grazing land
0.46
Forest land
1.29
Fishing grounds (Marine, Inland)
0.37
Built-up land (or Infrastructure)
2.52
Carbon
1.29
Modified from Figure 11.1 in Lin et al. (2019), p 54
1.3 Conceptual Framework
7
what is the natural capital in stock form that allows the growing of crops, and how to
account for it, may address the problem of quality loss of the soil and the sustainability of management practices. A similar rationale may be applied to other land
types, in consideration also of deforestation, the collapse of fisheries, and accumulation of CO 2 in the atmosphere.
1.3.1 Equations
The way that the Ecological Footprint is calculated is based on the GAEZ (Global
Agro-Ecological Zones) model that ascribes a level of productivity to different
biomes globally and so affects equivalence factors (EQF) used, themselves calculated through suitability indexes derived from GAEZ (Table 1.1 modified from Lin
et al. 2019). For instance, the model considers crop land to be the most productive
land-use type, followed by forest land, then shrub and grassland (or grazing land),
and so on. There is an assumption that built-up land occupies formerly productive
crop land. For this reason, its EF C and BC (see Box 1.1) values are the same each
year, as evident in the National Footprint Accounts 2020 Edition (Global Footprint
Network 2020, using 2016 data) on which this study is based. It should be noted that
equivalence values change with each edition of the National Footprint Accounts,
thereby, setting the entire cross-temporal record (since 1961) for each new edition.
The main equations used are detailed in Box 1.2 based on Lin et al. (2019). Some
of these equations depend on inputs either as data from a database (e.g., Eq. 6.2:
World Resources Institute Global Land Cover Classification Database 2008) or
estimates and specific figures derived from known sources (e.g. Eq. 6.2: Gulland
1971; Eq. 6.1: Pauly and Christensen 1995). Some of these sources are outdated
and this will be considered later in Chap. 6 (Data Quality).
Table 1.1 EQFs for different land types
Land type
Equivalence factor (gha/wha)
Crop land
2.52
Grazing land
0.46
Forest land
1.29
Fishing grounds (Marine, Inland)
0.37
Built-up land (or Infrastructure)
2.52
Carbon
1.29
Modified from Figure 11.1 in Lin et al. (2019), p 54
1.3 Conceptual Framework
7