

The concentration of organic C in the soil that was
amended with 80 Mg ha
−1 yr
−1 of cattle manure did not
change significantly. However, manure application at rates
of 160 and 320 Mg ha
−1 yr
−1 significantly increased the
concentration of organic C and POM-C, while there was a
significant decrease in the amount of MAOM-C. This indicates that most of the organic matter derived from the cattle
manure accumulated in the form of POM and was then
decomposed and transformed into MAOM. The preferential
accumulation of POM was also observed in Andosol upland
fields amended with compost and crop residues (Aoyama
and Kumakura 2002).
The application of organic matter altered SOM not only
quantitatively but also qualitatively. In the field plots
described above, the application of manure lowered the
humification degree of humic acid in the soil and increased
the proportion of large-molecular-size humic acid. The
qualitative changes in the organic matter of the Andosol
upon manure application were mainly due to the accumulation of manure-derived POM.
An adequate supply of water and oxygen to plant roots is
essential for the normal growth of plants in upland fields.
The supply of water and oxygen is related to the presence of
soil aggregates. Thus, we investigated the effects of the
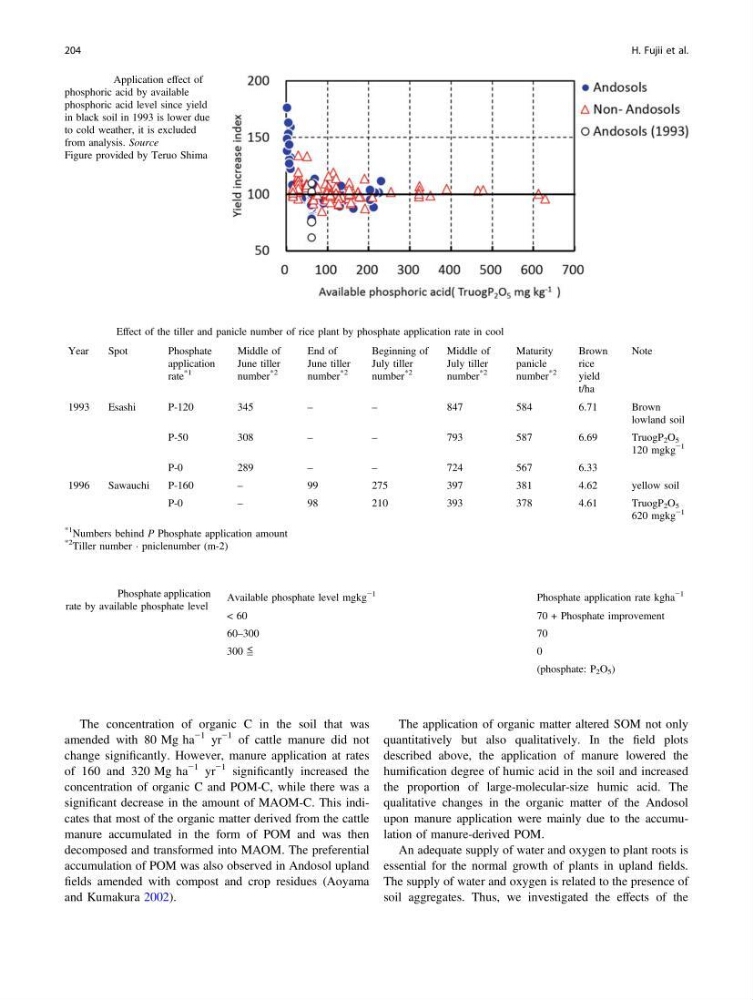
Fig. 6.12 Application effect of
phosphoric acid by available
phosphoric acid level since yield
in black soil in 1993 is lower due
to cold weather, it is excluded
from analysis. Source
Figure provided by Teruo Shima
Table 6.5 Effect of the tiller and panicle number of rice plant by phosphate application rate in cool
Year
Spot
Phosphate
application
rate
*1
Middle of
June tiller
number
*2
End of
June tiller
number
*2
Beginning of
July tiller
number
*2
Middle of
July tiller
number
*2
Maturity
panicle
number
*2
Brown
rice
yield
t/ha
Note
1993
Esashi
P-120
345
–
–
847
584
6.71
Brown
lowland soil
P-50
308
–
–
793
587
6.69
TruogP 2 O 5
120 mgkg
−1
P-0
289
–
–
724
567
6.33
1996
Sawauchi
P-160
–
99
275
397
381
4.62
yellow soil
P-0
–
98
210
393
378
4.61
TruogP 2 O 5
620 mgkg
−1
*1
Numbers behind P Phosphate application amount
*2
Tiller number Á pniclenumber (m-2)
Table 6.6 Phosphate application
rate by available phosphate level
Available phosphate level mgkg
−1
Phosphate application rate kgha
−1
< 60
70 + Phosphate improvement
60–300
70
300 ≦
0
(phosphate: P 2 O 5 )
204
H. Fujii et al.
amended with 80 Mg ha
−1 yr
−1 of cattle manure did not
change significantly. However, manure application at rates
of 160 and 320 Mg ha
−1 yr
−1 significantly increased the
concentration of organic C and POM-C, while there was a
significant decrease in the amount of MAOM-C. This indicates that most of the organic matter derived from the cattle
manure accumulated in the form of POM and was then
decomposed and transformed into MAOM. The preferential
accumulation of POM was also observed in Andosol upland
fields amended with compost and crop residues (Aoyama
and Kumakura 2002).
The application of organic matter altered SOM not only
quantitatively but also qualitatively. In the field plots
described above, the application of manure lowered the
humification degree of humic acid in the soil and increased
the proportion of large-molecular-size humic acid. The
qualitative changes in the organic matter of the Andosol
upon manure application were mainly due to the accumulation of manure-derived POM.
An adequate supply of water and oxygen to plant roots is
essential for the normal growth of plants in upland fields.
The supply of water and oxygen is related to the presence of
soil aggregates. Thus, we investigated the effects of the
Fig. 6.12 Application effect of
phosphoric acid by available
phosphoric acid level since yield
in black soil in 1993 is lower due
to cold weather, it is excluded
from analysis. Source
Figure provided by Teruo Shima
Table 6.5 Effect of the tiller and panicle number of rice plant by phosphate application rate in cool
Year
Spot
Phosphate
application
rate
*1
Middle of
June tiller
number
*2
End of
June tiller
number
*2
Beginning of
July tiller
number
*2
Middle of
July tiller
number
*2
Maturity
panicle
number
*2
Brown
rice
yield
t/ha
Note
1993
Esashi
P-120
345
–
–
847
584
6.71
Brown
lowland soil
P-50
308
–
–
793
587
6.69
TruogP 2 O 5
120 mgkg
−1
P-0
289
–
–
724
567
6.33
1996
Sawauchi
P-160
–
99
275
397
381
4.62
yellow soil
P-0
–
98
210
393
378
4.61
TruogP 2 O 5
620 mgkg
−1
*1
Numbers behind P Phosphate application amount
*2
Tiller number Á pniclenumber (m-2)
Table 6.6 Phosphate application
rate by available phosphate level
Available phosphate level mgkg
−1
Phosphate application rate kgha
−1
< 60
70 + Phosphate improvement
60–300
70
300 ≦
0
(phosphate: P 2 O 5 )
204
H. Fujii et al.