

wheat, and potato, since the annual organic matter application rate is 2.4 Mg ha
−1 in dry matter, it is presumed that the
total carbon and total nitrogen in the soil can be maintained
mostly by 4-year crop rotation. Additionally, when the
application rate of organic matter was about 5.0 Mg ha
−1 in
dry matter, both the total carbon and total nitrogen in the soil
rose by about 10% (Nakatsu and Tamura 2008). However, as
with chemical fertilizers, it is necessary to pay attention to
the fact that the excessive application of organic matter, such
as compost, may cause excess nitrogen loading and nitrate
contamination of groundwater.
The amount of nutrient input and output as fertilization,
incorporating crop residue, and harvest depend on the crop
species. In the case of sugar beet, the difference between
nutrient input and nutrient output is greatly positive for nitrogen and potassium (Okumura et al. 1997). Because crop
rotation combines multiple crops with different nutrient
balances, it is also convenient for optimizing soil fertility.
(3) Improvement of cropping systems
Incorporating green manures into crop rotations is effective
not only for avoiding replant disease but also for stabilizing
the production of profitable crops and supplying organic
matter to the soil. In Hokkaido, the proportion of succeeding
crop green manures cultivated after the harvest of profitable
crops is large. Oat, sunflower, and white mustard are mainly
cultivated in winter wheat fields. The dry matter of green
manure used is 2.6–0.6 Mg ha
−1 , the amount of nitrogen
reduction is 49–88 kg ha
−1 , and the reduction in potassium
is 102–158 kg K 2 O ha
−1 . Since fallow green manures cultivated by abandoning the cultivation of profitable crops are
cultivated from spring to summer with good weather conditions, dry matter is 4.6–10.9 Mg ha
−1 , the amount of
reduction in nitrogen is 80–151 kg ha
−1 , and the reduction
in potassium is 158–457 kg K 2 O ha
−1 , more than for the
succeeding green manures. The reduction in these elements
in the field not only increases the amount of humus, nitrogen
fertility, and cation exchange capacity (CEC), but also
improves the overall physicochemical properties of the soil,
for example, by decreasing soil hardness (Akashi et al.
2005).
5.3.3 Fertility Management
(1) Current status of upland soils
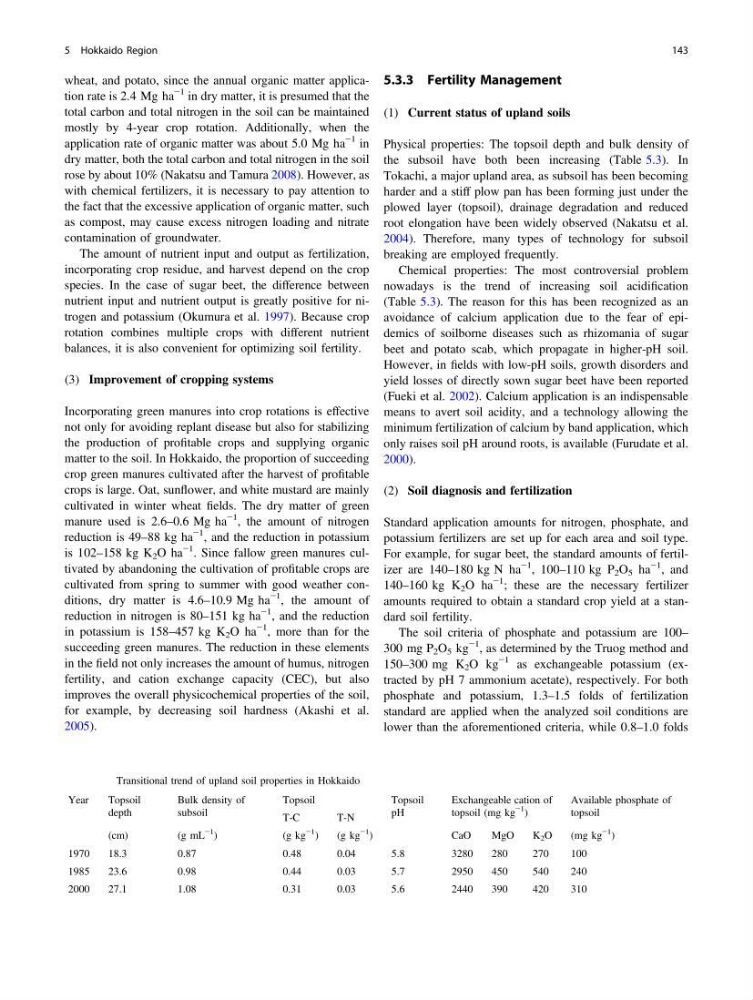
Physical properties: The topsoil depth and bulk density of
the subsoil have both been increasing (Table 5.3). In
Tokachi, a major upland area, as subsoil has been becoming
harder and a stiff plow pan has been forming just under the
plowed layer (topsoil), drainage degradation and reduced
root elongation have been widely observed (Nakatsu et al.
2004). Therefore, many types of technology for subsoil
breaking are employed frequently.
Chemical properties: The most controversial problem
nowadays is the trend of increasing soil acidification
(Table 5.3). The reason for this has been recognized as an
avoidance of calcium application due to the fear of epidemics of soilborne diseases such as rhizomania of sugar
beet and potato scab, which propagate in higher-pH soil.
However, in fields with low-pH soils, growth disorders and
yield losses of directly sown sugar beet have been reported
(Fueki et al. 2002). Calcium application is an indispensable
means to avert soil acidity, and a technology allowing the
minimum fertilization of calcium by band application, which
only raises soil pH around roots, is available (Furudate et al.
2000).
(2) Soil diagnosis and fertilization
Standard application amounts for nitrogen, phosphate, and
potassium fertilizers are set up for each area and soil type.
For example, for sugar beet, the standard amounts of fertilizer are 140–180 kg N ha
−1
, 100–110 kg P 2 O 5 ha
−1 , and
140–160 kg K 2 O ha
−1
; these are the necessary fertilizer
amounts required to obtain a standard crop yield at a standard soil fertility.
The soil criteria of phosphate and potassium are 100–
300 mg P 2 O 5 kg
−1
, as determined by the Truog method and
150–300 mg K 2 O kg
−1 as exchangeable potassium (extracted by pH 7 ammonium acetate), respectively. For both
phosphate and potassium, 1.3–1.5 folds of fertilization
standard are applied when the analyzed soil conditions are
lower than the aforementioned criteria, while 0.8–1.0 folds
Table 5.3 Transitional trend of upland soil properties in Hokkaido
Year
Topsoil
depth
Bulk density of
subsoil
Topsoil
Topsoil
pH
Exchangeable cation of
topsoil (mg kg
−1
)
Available phosphate of
topsoil
T-C
T-N
(cm)
(g mL
−1
)
( g k g
−1
)
(g kg
−1 )
CaO
MgO
K 2 O
(mg kg
−1
)
1970
18.3
0.87
0.48
0.04
5.8
3280
280
270
100
1985
23.6
0.98
0.44
0.03
5.7
2950
450
540
240
2000
27.1
1.08
0.31
0.03
5.6
2440
390
420
310
5 Hokkaido Region
143
−1 in dry matter, it is presumed that the
total carbon and total nitrogen in the soil can be maintained
mostly by 4-year crop rotation. Additionally, when the
application rate of organic matter was about 5.0 Mg ha
−1 in
dry matter, both the total carbon and total nitrogen in the soil
rose by about 10% (Nakatsu and Tamura 2008). However, as
with chemical fertilizers, it is necessary to pay attention to
the fact that the excessive application of organic matter, such
as compost, may cause excess nitrogen loading and nitrate
contamination of groundwater.
The amount of nutrient input and output as fertilization,
incorporating crop residue, and harvest depend on the crop
species. In the case of sugar beet, the difference between
nutrient input and nutrient output is greatly positive for nitrogen and potassium (Okumura et al. 1997). Because crop
rotation combines multiple crops with different nutrient
balances, it is also convenient for optimizing soil fertility.
(3) Improvement of cropping systems
Incorporating green manures into crop rotations is effective
not only for avoiding replant disease but also for stabilizing
the production of profitable crops and supplying organic
matter to the soil. In Hokkaido, the proportion of succeeding
crop green manures cultivated after the harvest of profitable
crops is large. Oat, sunflower, and white mustard are mainly
cultivated in winter wheat fields. The dry matter of green
manure used is 2.6–0.6 Mg ha
−1 , the amount of nitrogen
reduction is 49–88 kg ha
−1 , and the reduction in potassium
is 102–158 kg K 2 O ha
−1 . Since fallow green manures cultivated by abandoning the cultivation of profitable crops are
cultivated from spring to summer with good weather conditions, dry matter is 4.6–10.9 Mg ha
−1 , the amount of
reduction in nitrogen is 80–151 kg ha
−1 , and the reduction
in potassium is 158–457 kg K 2 O ha
−1 , more than for the
succeeding green manures. The reduction in these elements
in the field not only increases the amount of humus, nitrogen
fertility, and cation exchange capacity (CEC), but also
improves the overall physicochemical properties of the soil,
for example, by decreasing soil hardness (Akashi et al.
2005).
5.3.3 Fertility Management
(1) Current status of upland soils
Physical properties: The topsoil depth and bulk density of
the subsoil have both been increasing (Table 5.3). In
Tokachi, a major upland area, as subsoil has been becoming
harder and a stiff plow pan has been forming just under the
plowed layer (topsoil), drainage degradation and reduced
root elongation have been widely observed (Nakatsu et al.
2004). Therefore, many types of technology for subsoil
breaking are employed frequently.
Chemical properties: The most controversial problem
nowadays is the trend of increasing soil acidification
(Table 5.3). The reason for this has been recognized as an
avoidance of calcium application due to the fear of epidemics of soilborne diseases such as rhizomania of sugar
beet and potato scab, which propagate in higher-pH soil.
However, in fields with low-pH soils, growth disorders and
yield losses of directly sown sugar beet have been reported
(Fueki et al. 2002). Calcium application is an indispensable
means to avert soil acidity, and a technology allowing the
minimum fertilization of calcium by band application, which
only raises soil pH around roots, is available (Furudate et al.
2000).
(2) Soil diagnosis and fertilization
Standard application amounts for nitrogen, phosphate, and
potassium fertilizers are set up for each area and soil type.
For example, for sugar beet, the standard amounts of fertilizer are 140–180 kg N ha
−1
, 100–110 kg P 2 O 5 ha
−1 , and
140–160 kg K 2 O ha
−1
; these are the necessary fertilizer
amounts required to obtain a standard crop yield at a standard soil fertility.
The soil criteria of phosphate and potassium are 100–
300 mg P 2 O 5 kg
−1
, as determined by the Truog method and
150–300 mg K 2 O kg
−1 as exchangeable potassium (extracted by pH 7 ammonium acetate), respectively. For both
phosphate and potassium, 1.3–1.5 folds of fertilization
standard are applied when the analyzed soil conditions are
lower than the aforementioned criteria, while 0.8–1.0 folds
Table 5.3 Transitional trend of upland soil properties in Hokkaido
Year
Topsoil
depth
Bulk density of
subsoil
Topsoil
Topsoil
pH
Exchangeable cation of
topsoil (mg kg
−1
)
Available phosphate of
topsoil
T-C
T-N
(cm)
(g mL
−1
)
( g k g
−1
)
(g kg
−1 )
CaO
MgO
K 2 O
(mg kg
−1
)
1970
18.3
0.87
0.48
0.04
5.8
3280
280
270
100
1985
23.6
0.98
0.44
0.03
5.7
2950
450
540
240
2000
27.1
1.08
0.31
0.03
5.6
2440
390
420
310
5 Hokkaido Region
143