

Rankings for Carbon Emissions and Economic Growth Decoupling
69
Decoupling: Concepts and Indicators
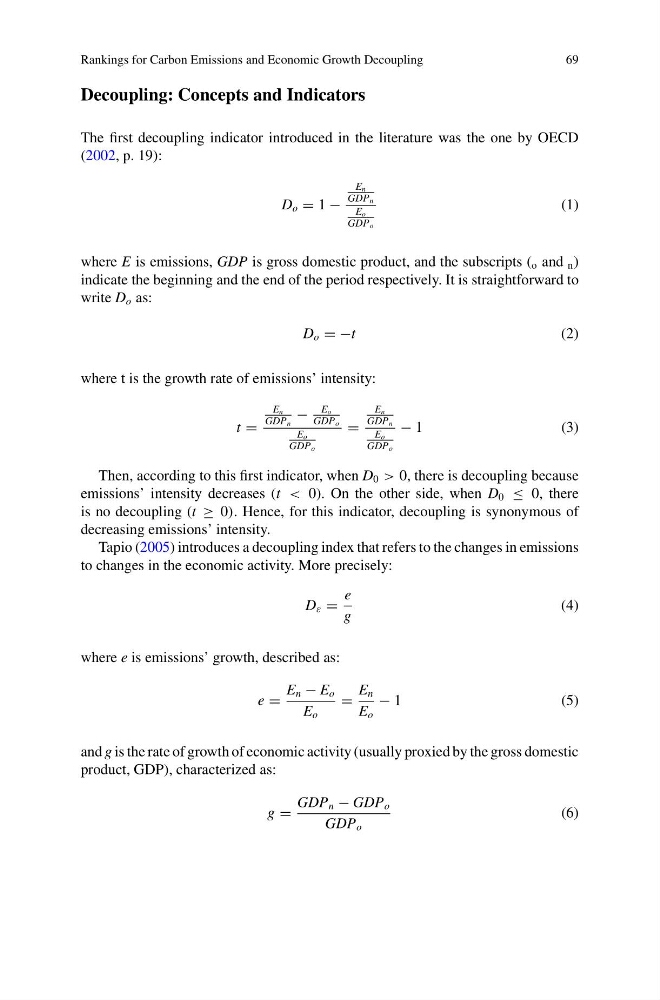
The first decoupling indicator introduced in the literature was the one by OECD
(2002, p. 19):
D o = 1 −
E n
GDP n
E o
GDP o
(1)
where E is emissions, GDP is gross domestic product, and the subscripts ( o and n )
indicate the beginning and the end of the period respectively. It is straightforward to
write D o as:
D o = −t
(2)
where t is the growth rate of emissions’ intensity:
t =
E n
GDP n
−
E o
GDP o
E o
GDP o
=
E n
GDP n
E o
GDP o
− 1
( 3 )
Then, according to this first indicator, when D 0 > 0, there is decoupling because
emissions’ intensity decreases (t < 0). On the other side, when D 0 ≤ 0, there
is no decoupling (t ≥ 0). Hence, for this indicator, decoupling is synonymous of
decreasing emissions’ intensity.
Tapio (2005) introduces a decoupling index that refers to the changes in emissions
to changes in the economic activity. More precisely:
D ε =
e
g
(4)
where e is emissions’ growth, described as:
e =
E n − E o
E o
=
E n
E o
− 1
( 5 )
and g is the rate of growth of economic activity (usually proxied by the gross domestic
product, GDP), characterized as:
g =
GDP n − GDP o
GDP o
(6)
69
Decoupling: Concepts and Indicators
The first decoupling indicator introduced in the literature was the one by OECD
(2002, p. 19):
D o = 1 −
E n
GDP n
E o
GDP o
(1)
where E is emissions, GDP is gross domestic product, and the subscripts ( o and n )
indicate the beginning and the end of the period respectively. It is straightforward to
write D o as:
D o = −t
(2)
where t is the growth rate of emissions’ intensity:
t =
E n
GDP n
−
E o
GDP o
E o
GDP o
=
E n
GDP n
E o
GDP o
− 1
( 3 )
Then, according to this first indicator, when D 0 > 0, there is decoupling because
emissions’ intensity decreases (t < 0). On the other side, when D 0 ≤ 0, there
is no decoupling (t ≥ 0). Hence, for this indicator, decoupling is synonymous of
decreasing emissions’ intensity.
Tapio (2005) introduces a decoupling index that refers to the changes in emissions
to changes in the economic activity. More precisely:
D ε =
e
g
(4)
where e is emissions’ growth, described as:
e =
E n − E o
E o
=
E n
E o
− 1
( 5 )
and g is the rate of growth of economic activity (usually proxied by the gross domestic
product, GDP), characterized as:
g =
GDP n − GDP o
GDP o
(6)