

26
H. Ahumada and M. Cornejo
1000
1500
2000
2500
3000
320 340 360 380 400
CO2
yield
Argentina
1000
1500
2000
2500
3000
320 340 360 380 400
CO2
yield
Brazil
1500
2000
2500
3000
3500
320 340 360 380 400
CO2
yield
United States
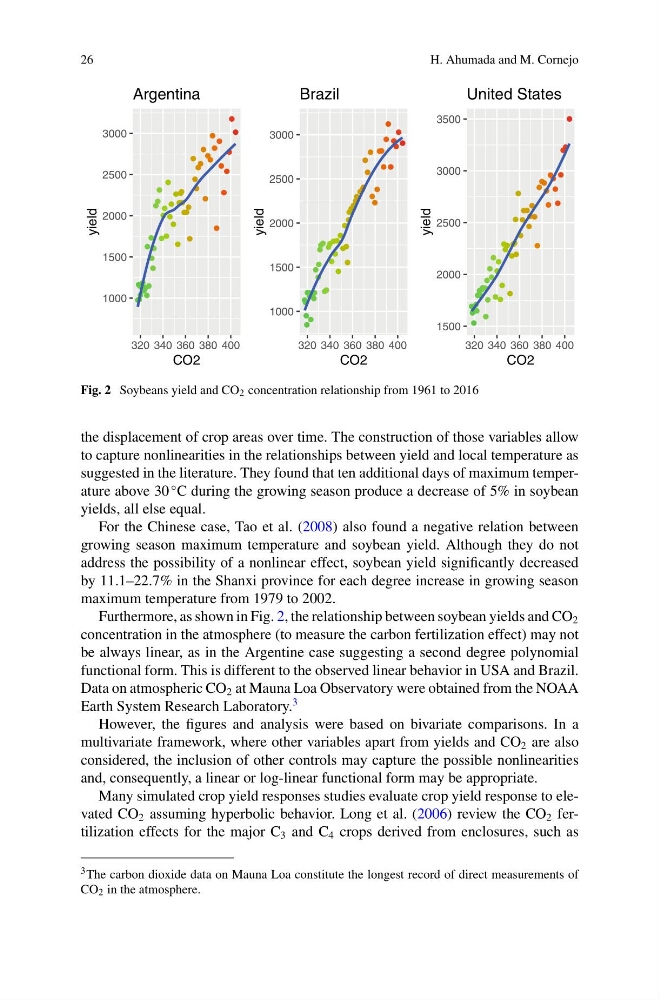
Fig. 2 Soybeans yield and CO 2 concentration relationship from 1961 to 2016
the displacement of crop areas over time. The construction of those variables allow
to capture nonlinearities in the relationships between yield and local temperature as
suggested in the literature. They found that ten additional days of maximum temperature above 30
◦ C during the growing season produce a decrease of 5% in soybean
yields, all else equal.
For the Chinese case, Tao et al. (2008) also found a negative relation between
growing season maximum temperature and soybean yield. Although they do not
address the possibility of a nonlinear effect, soybean yield significantly decreased
by 11.1–22.7% in the Shanxi province for each degree increase in growing season
maximum temperature from 1979 to 2002.
Furthermore, as shown in Fig. 2, the relationship between soybean yields and CO 2
concentration in the atmosphere (to measure the carbon fertilization effect) may not
be always linear, as in the Argentine case suggesting a second degree polynomial
functional form. This is different to the observed linear behavior in USA and Brazil.
Data on atmospheric CO 2 at Mauna Loa Observatory were obtained from the NOAA
Earth System Research Laboratory.
3
However, the figures and analysis were based on bivariate comparisons. In a
multivariate framework, where other variables apart from yields and CO 2 are also
considered, the inclusion of other controls may capture the possible nonlinearities
and, consequently, a linear or log-linear functional form may be appropriate.
Many simulated crop yield responses studies evaluate crop yield response to elevated CO 2 assuming hyperbolic behavior. Long et al. (2006) review the CO 2 fertilization effects for the major C 3 and C 4 crops derived from enclosures, such as
3 The carbon dioxide data on Mauna Loa constitute the longest record of direct measurements of
CO 2 in the atmosphere.
H. Ahumada and M. Cornejo
1000
1500
2000
2500
3000
320 340 360 380 400
CO2
yield
Argentina
1000
1500
2000
2500
3000
320 340 360 380 400
CO2
yield
Brazil
1500
2000
2500
3000
3500
320 340 360 380 400
CO2
yield
United States
Fig. 2 Soybeans yield and CO 2 concentration relationship from 1961 to 2016
the displacement of crop areas over time. The construction of those variables allow
to capture nonlinearities in the relationships between yield and local temperature as
suggested in the literature. They found that ten additional days of maximum temperature above 30
◦ C during the growing season produce a decrease of 5% in soybean
yields, all else equal.
For the Chinese case, Tao et al. (2008) also found a negative relation between
growing season maximum temperature and soybean yield. Although they do not
address the possibility of a nonlinear effect, soybean yield significantly decreased
by 11.1–22.7% in the Shanxi province for each degree increase in growing season
maximum temperature from 1979 to 2002.
Furthermore, as shown in Fig. 2, the relationship between soybean yields and CO 2
concentration in the atmosphere (to measure the carbon fertilization effect) may not
be always linear, as in the Argentine case suggesting a second degree polynomial
functional form. This is different to the observed linear behavior in USA and Brazil.
Data on atmospheric CO 2 at Mauna Loa Observatory were obtained from the NOAA
Earth System Research Laboratory.
3
However, the figures and analysis were based on bivariate comparisons. In a
multivariate framework, where other variables apart from yields and CO 2 are also
considered, the inclusion of other controls may capture the possible nonlinearities
and, consequently, a linear or log-linear functional form may be appropriate.
Many simulated crop yield responses studies evaluate crop yield response to elevated CO 2 assuming hyperbolic behavior. Long et al. (2006) review the CO 2 fertilization effects for the major C 3 and C 4 crops derived from enclosures, such as
3 The carbon dioxide data on Mauna Loa constitute the longest record of direct measurements of
CO 2 in the atmosphere.