

The Impact of Temperature on Mortality …
9
a
b
c
b
c
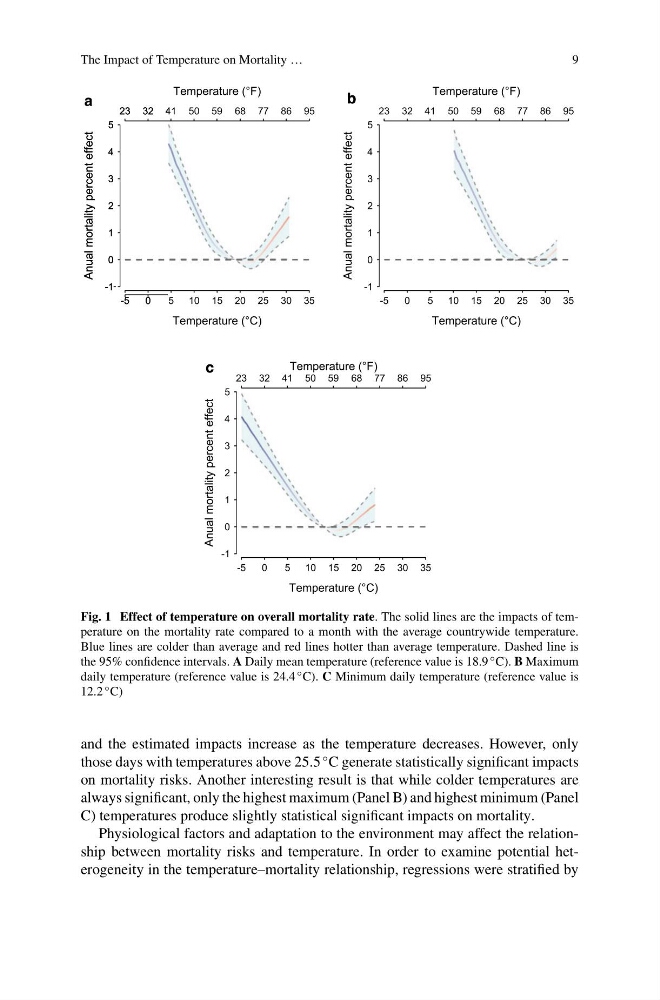
Fig. 1 Effect of temperature on overall mortality rate. The solid lines are the impacts of temperature on the mortality rate compared to a month with the average countrywide temperature.
Blue lines are colder than average and red lines hotter than average temperature. Dashed line is
the 95% confidence intervals. A Daily mean temperature (reference value is 18.9 ◦ C). B Maximum
daily temperature (reference value is 24.4 ◦ C). C Minimum daily temperature (reference value is
12.2 ◦ C)
and the estimated impacts increase as the temperature decreases. However, only
those days with temperatures above 25.5
◦ C generate statistically significant impacts
on mortality risks. Another interesting result is that while colder temperatures are
always significant, only the highest maximum (Panel B) and highest minimum (Panel
C) temperatures produce slightly statistical significant impacts on mortality.
Physiological factors and adaptation to the environment may affect the relationship between mortality risks and temperature. In order to examine potential heterogeneity in the temperature–mortality relationship, regressions were stratified by
9
a
b
c
b
c
Fig. 1 Effect of temperature on overall mortality rate. The solid lines are the impacts of temperature on the mortality rate compared to a month with the average countrywide temperature.
Blue lines are colder than average and red lines hotter than average temperature. Dashed line is
the 95% confidence intervals. A Daily mean temperature (reference value is 18.9 ◦ C). B Maximum
daily temperature (reference value is 24.4 ◦ C). C Minimum daily temperature (reference value is
12.2 ◦ C)
and the estimated impacts increase as the temperature decreases. However, only
those days with temperatures above 25.5
◦ C generate statistically significant impacts
on mortality risks. Another interesting result is that while colder temperatures are
always significant, only the highest maximum (Panel B) and highest minimum (Panel
C) temperatures produce slightly statistical significant impacts on mortality.
Physiological factors and adaptation to the environment may affect the relationship between mortality risks and temperature. In order to examine potential heterogeneity in the temperature–mortality relationship, regressions were stratified by