

54
3.3.5 Overlays
In this method, maps depicting environmental characteristics of a project area with
and without project will be superimposed. The maps would be self-explanatory
depicting places and impacts such as:
1. Area of deforestation due to the project
2. Area of possible flooding
3. Area of possible soil erosion
4. Area of water bodies likely to get polluted
5. Location of wildlife corridor, which is likely to be blocked
6. Area likely to get affected by air pollution after project
7. Area where noise levels are likely to increase
8. Location likely to be affected by land slide
9. Area where people are likely to get jobs
10. Area where people are likely to get water/electricity due to project
Sl.
No. Attribute
Impact
Land Air
Water Noise
Flora/
Fauna Socio-economic
1.
Resource depletion
−4LI −3LR −3LR −2LR −2LR +2SR
2.
Coal transportation
−2LR −2LR −2LR −2LR −2LR +2SR
3.
Receiving coal
−1LR −1LR −1LR −1LR −1LR +1SR
4.
Crushing coal
−1LR −1LR −1LR −1LR −1LR +1SR
5.
Feeding coal to boiler
−1LR −1LR −1LR −1LR −1LR +1SR
6.
Combustion of coal
−1LR −4LR −3LR −1LR −1LR +1SR
7.
Water treatment
−1LR
−1LR +1SR
8.. Supply of water to boiler
−1LR −1LR −1LR −1LR −1LR +1SR
9.
Water pumping
−1LR −1LR −1LR −1LR −1LR +1SR
10. Water storage
−1LR
−1LR +1SR
11. Operation of turbine
−1LR −1LR −1LR −1LR −1LR +1SR
12. Use and maintenance of
transformer
−1LR
+1SR
13. Bottom ash management
−1LR −1LR −1LR
−1LR +1SR
14. Ash pond management
−1LR
−1LR
−1LR +1SR
15. Use and maintenance of
township
−1LR −1LR −1LR −1LR −1LR +2SR
16. Maintenance of greenbelt
+4LR +4LR +4LR +4LR +4LR +1SR
17. Power generation
+4LR
+4SR
18. Employment opportunity
+4LR
19. Local economy
+4LR
Note:
+ : Positive, − : Negative, 1: Low, 2: Average, 3: High, 4: Very high, S: Short term, L: Long term,
R: Reversible, I: Irreversible
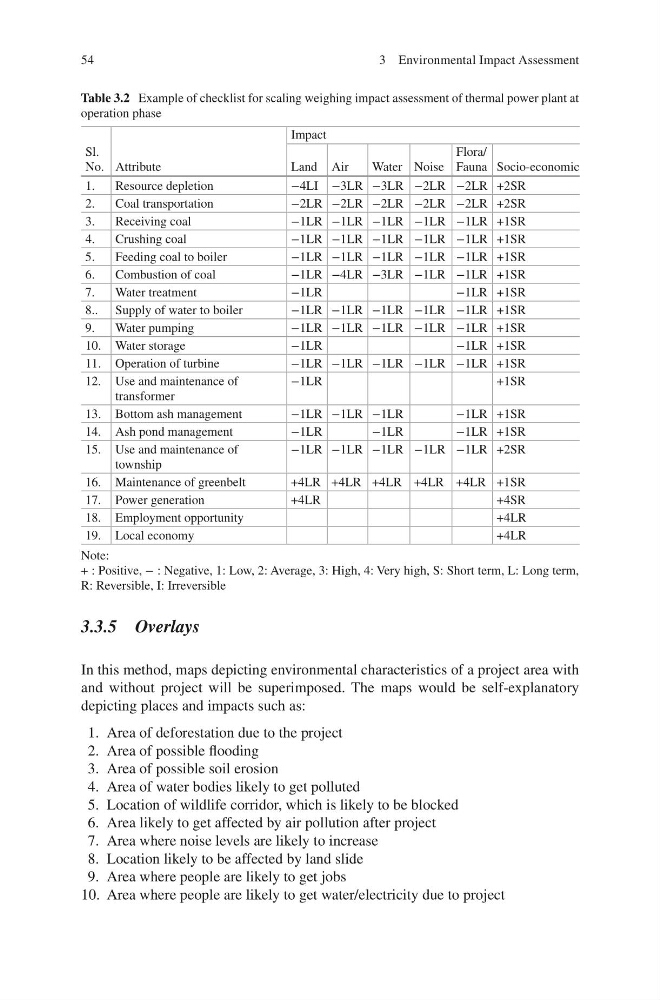
Table 3.2 Example of checklist for scaling weighing impact assessment of thermal power plant at
operation phase
3 Environmental Impact Assessment
3.3.5 Overlays
In this method, maps depicting environmental characteristics of a project area with
and without project will be superimposed. The maps would be self-explanatory
depicting places and impacts such as:
1. Area of deforestation due to the project
2. Area of possible flooding
3. Area of possible soil erosion
4. Area of water bodies likely to get polluted
5. Location of wildlife corridor, which is likely to be blocked
6. Area likely to get affected by air pollution after project
7. Area where noise levels are likely to increase
8. Location likely to be affected by land slide
9. Area where people are likely to get jobs
10. Area where people are likely to get water/electricity due to project
Sl.
No. Attribute
Impact
Land Air
Water Noise
Flora/
Fauna Socio-economic
1.
Resource depletion
−4LI −3LR −3LR −2LR −2LR +2SR
2.
Coal transportation
−2LR −2LR −2LR −2LR −2LR +2SR
3.
Receiving coal
−1LR −1LR −1LR −1LR −1LR +1SR
4.
Crushing coal
−1LR −1LR −1LR −1LR −1LR +1SR
5.
Feeding coal to boiler
−1LR −1LR −1LR −1LR −1LR +1SR
6.
Combustion of coal
−1LR −4LR −3LR −1LR −1LR +1SR
7.
Water treatment
−1LR
−1LR +1SR
8.. Supply of water to boiler
−1LR −1LR −1LR −1LR −1LR +1SR
9.
Water pumping
−1LR −1LR −1LR −1LR −1LR +1SR
10. Water storage
−1LR
−1LR +1SR
11. Operation of turbine
−1LR −1LR −1LR −1LR −1LR +1SR
12. Use and maintenance of
transformer
−1LR
+1SR
13. Bottom ash management
−1LR −1LR −1LR
−1LR +1SR
14. Ash pond management
−1LR
−1LR
−1LR +1SR
15. Use and maintenance of
township
−1LR −1LR −1LR −1LR −1LR +2SR
16. Maintenance of greenbelt
+4LR +4LR +4LR +4LR +4LR +1SR
17. Power generation
+4LR
+4SR
18. Employment opportunity
+4LR
19. Local economy
+4LR
Note:
+ : Positive, − : Negative, 1: Low, 2: Average, 3: High, 4: Very high, S: Short term, L: Long term,
R: Reversible, I: Irreversible
Table 3.2 Example of checklist for scaling weighing impact assessment of thermal power plant at
operation phase
3 Environmental Impact Assessment