

292
R. Rosemary and D. Evensen
Table 14.2 Type of article,
valence, geographic focus,
efficacy type, and year of
publication
Media coverages
Number (and % of sample)
of articles
Type of article
• News
• Opinion
124 (78%)
35 (22%)
Valence
• Positive
• Negative
68 (45%)
84 (55%)
Geographic focus of issues
• Local
• Global
111 (70%)
41 (26%)
Efficacy type
• Self-efficacy
• Response efficacy
• External efficacy
• Group efficacy
3 (2%)
43 (27%)
89 (56%)
17 (11%)
Year of publication
• 2011
• 2012
• 2013
• 2014
• 2015
• 2016
• 2017
• 2018
13 (8%)
14 (9%)
5 (3%)
16 (10%)
23 (15%)
18 (11%)
32 (20%)
38 (24%)
* Note some boxes only total to 152 articles and 96% because seven
articles contained no efficacy information
from 2017 to 2018, the ratio was 21/43 (this difference in valence across these two
groupings of publication dates had a chi-square of 6.4, p < 0.01, Cramer’s V [effect
size] = 0.21). The negative bent to efficacy information is also due to far more
articles featuring response and external efficacy information, and these two types
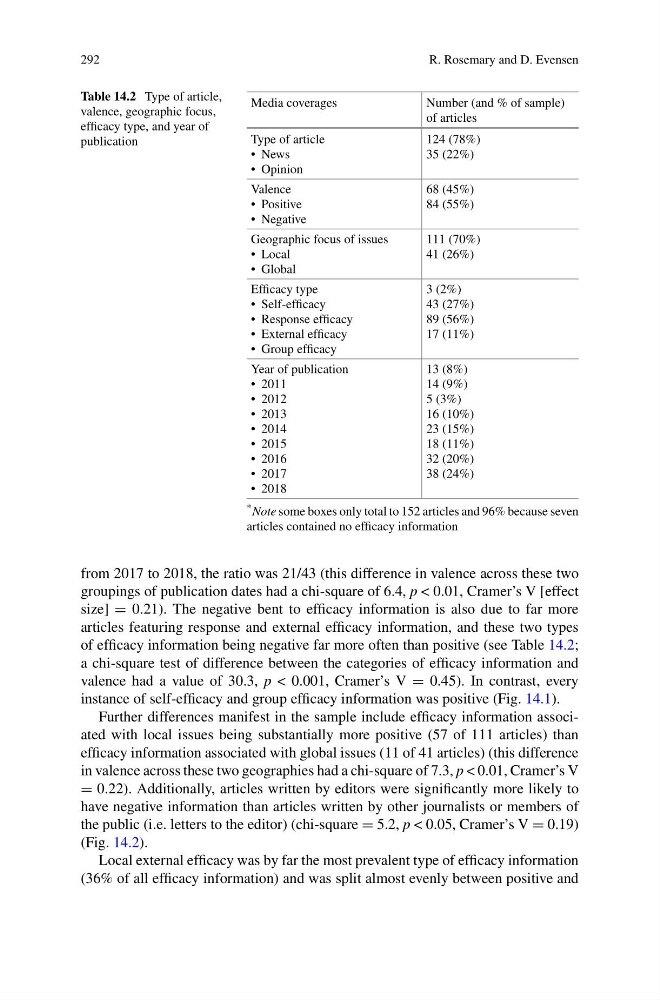
of efficacy information being negative far more often than positive (see Table 14.2;
a chi-square test of difference between the categories of efficacy information and
valence had a value of 30.3, p < 0.001, Cramer’s V = 0.45). In contrast, every
instance of self-efficacy and group efficacy information was positive (Fig. 14.1).
Further differences manifest in the sample include efficacy information associated with local issues being substantially more positive (57 of 111 articles) than
efficacy information associated with global issues (11 of 41 articles) (this difference
in valence across these two geographies had a chi-square of 7.3, p < 0.01, Cramer’s V
= 0.22). Additionally, articles written by editors were significantly more likely to
have negative information than articles written by other journalists or members of
the public (i.e. letters to the editor) (chi-square = 5.2, p < 0.05, Cramer’s V = 0.19)
(Fig. 14.2).
Local external efficacy was by far the most prevalent type of efficacy information
(36% of all efficacy information) and was split almost evenly between positive and
R. Rosemary and D. Evensen
Table 14.2 Type of article,
valence, geographic focus,
efficacy type, and year of
publication
Media coverages
Number (and % of sample)
of articles
Type of article
• News
• Opinion
124 (78%)
35 (22%)
Valence
• Positive
• Negative
68 (45%)
84 (55%)
Geographic focus of issues
• Local
• Global
111 (70%)
41 (26%)
Efficacy type
• Self-efficacy
• Response efficacy
• External efficacy
• Group efficacy
3 (2%)
43 (27%)
89 (56%)
17 (11%)
Year of publication
• 2011
• 2012
• 2013
• 2014
• 2015
• 2016
• 2017
• 2018
13 (8%)
14 (9%)
5 (3%)
16 (10%)
23 (15%)
18 (11%)
32 (20%)
38 (24%)
* Note some boxes only total to 152 articles and 96% because seven
articles contained no efficacy information
from 2017 to 2018, the ratio was 21/43 (this difference in valence across these two
groupings of publication dates had a chi-square of 6.4, p < 0.01, Cramer’s V [effect
size] = 0.21). The negative bent to efficacy information is also due to far more
articles featuring response and external efficacy information, and these two types
of efficacy information being negative far more often than positive (see Table 14.2;
a chi-square test of difference between the categories of efficacy information and
valence had a value of 30.3, p < 0.001, Cramer’s V = 0.45). In contrast, every
instance of self-efficacy and group efficacy information was positive (Fig. 14.1).
Further differences manifest in the sample include efficacy information associated with local issues being substantially more positive (57 of 111 articles) than
efficacy information associated with global issues (11 of 41 articles) (this difference
in valence across these two geographies had a chi-square of 7.3, p < 0.01, Cramer’s V
= 0.22). Additionally, articles written by editors were significantly more likely to
have negative information than articles written by other journalists or members of
the public (i.e. letters to the editor) (chi-square = 5.2, p < 0.05, Cramer’s V = 0.19)
(Fig. 14.2).
Local external efficacy was by far the most prevalent type of efficacy information
(36% of all efficacy information) and was split almost evenly between positive and