

274
Z. Z. Mutiara et al.
3.18%
1.46%
0.10%
95.19%
0.01%
0.06%
10.45%
3.68%
0.60%
84.81%
0.06%
0.40%
Natural Resources ProtecƟon
Agriculture
Energy and Industry
TransportaƟon and regional ciƟes
planning
Health and EducaƟon
Disaster Risk ReducƟon, supporƟng policy
and regulaƟon
2015
2016
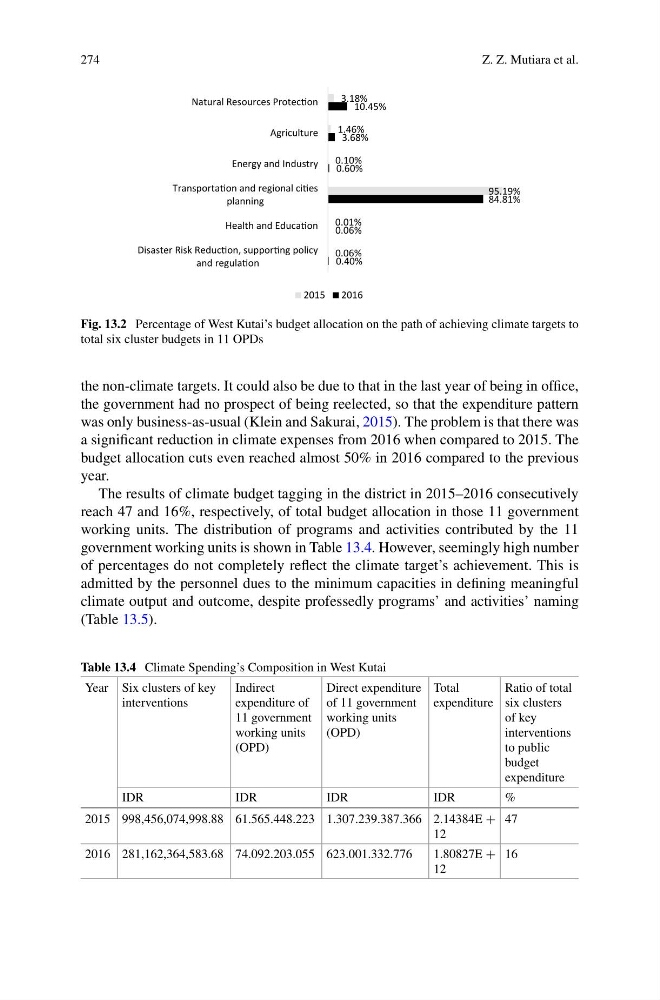
Fig. 13.2 Percentage of West Kutai’s budget allocation on the path of achieving climate targets to
total six cluster budgets in 11 OPDs
the non-climate targets. It could also be due to that in the last year of being in office,
the government had no prospect of being reelected, so that the expenditure pattern
was only business-as-usual (Klein and Sakurai, 2015). The problem is that there was
a significant reduction in climate expenses from 2016 when compared to 2015. The
budget allocation cuts even reached almost 50% in 2016 compared to the previous
year.
The results of climate budget tagging in the district in 2015–2016 consecutively
reach 47 and 16%, respectively, of total budget allocation in those 11 government
working units. The distribution of programs and activities contributed by the 11
government working units is shown in Table 13.4. However, seemingly high number
of percentages do not completely reflect the climate target’s achievement. This is
admitted by the personnel dues to the minimum capacities in defining meaningful
climate output and outcome, despite professedly programs’ and activities’ naming
(Table 13.5).
Table 13.4 Climate Spending’s Composition in West Kutai
Year Six clusters of key
interventions
Indirect
expenditure of
11 government
working units
(OPD)
Direct expenditure
of 11 government
working units
(OPD)
Total
expenditure
Ratio of total
six clusters
of key
interventions
to public
budget
expenditure
IDR
IDR
IDR
IDR
%
2015 998,456,074,998.88 61.565.448.223 1.307.239.387.366 2.14384E +
12
47
2016 281,162,364,583.68 74.092.203.055 623.001.332.776
1.80827E +
12
16
Z. Z. Mutiara et al.
3.18%
1.46%
0.10%
95.19%
0.01%
0.06%
10.45%
3.68%
0.60%
84.81%
0.06%
0.40%
Natural Resources ProtecƟon
Agriculture
Energy and Industry
TransportaƟon and regional ciƟes
planning
Health and EducaƟon
Disaster Risk ReducƟon, supporƟng policy
and regulaƟon
2015
2016
Fig. 13.2 Percentage of West Kutai’s budget allocation on the path of achieving climate targets to
total six cluster budgets in 11 OPDs
the non-climate targets. It could also be due to that in the last year of being in office,
the government had no prospect of being reelected, so that the expenditure pattern
was only business-as-usual (Klein and Sakurai, 2015). The problem is that there was
a significant reduction in climate expenses from 2016 when compared to 2015. The
budget allocation cuts even reached almost 50% in 2016 compared to the previous
year.
The results of climate budget tagging in the district in 2015–2016 consecutively
reach 47 and 16%, respectively, of total budget allocation in those 11 government
working units. The distribution of programs and activities contributed by the 11
government working units is shown in Table 13.4. However, seemingly high number
of percentages do not completely reflect the climate target’s achievement. This is
admitted by the personnel dues to the minimum capacities in defining meaningful
climate output and outcome, despite professedly programs’ and activities’ naming
(Table 13.5).
Table 13.4 Climate Spending’s Composition in West Kutai
Year Six clusters of key
interventions
Indirect
expenditure of
11 government
working units
(OPD)
Direct expenditure
of 11 government
working units
(OPD)
Total
expenditure
Ratio of total
six clusters
of key
interventions
to public
budget
expenditure
IDR
IDR
IDR
IDR
%
2015 998,456,074,998.88 61.565.448.223 1.307.239.387.366 2.14384E +
12
47
2016 281,162,364,583.68 74.092.203.055 623.001.332.776
1.80827E +
12
16