

12 Innovative Financing for Peatland Restoration in Indonesia
253
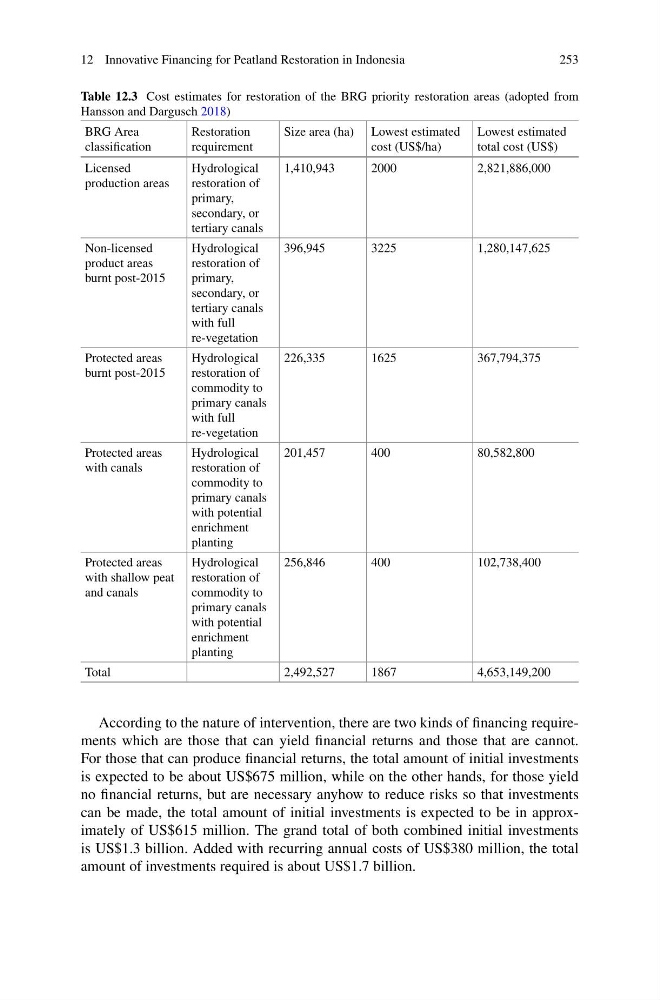
Table 12.3 Cost estimates for restoration of the BRG priority restoration areas (adopted from
Hansson and Dargusch 2018)
BRG Area
classification
Restoration
requirement
Size area (ha) Lowest estimated
cost (US$/ha)
Lowest estimated
total cost (US$)
Licensed
production areas
Hydrological
restoration of
primary,
secondary, or
tertiary canals
1,410,943
2000
2,821,886,000
Non-licensed
product areas
burnt post-2015
Hydrological
restoration of
primary,
secondary, or
tertiary canals
with full
re-vegetation
396,945
3225
1,280,147,625
Protected areas
burnt post-2015
Hydrological
restoration of
commodity to
primary canals
with full
re-vegetation
226,335
1625
367,794,375
Protected areas
with canals
Hydrological
restoration of
commodity to
primary canals
with potential
enrichment
planting
201,457
400
80,582,800
Protected areas
with shallow peat
and canals
Hydrological
restoration of
commodity to
primary canals
with potential
enrichment
planting
256,846
400
102,738,400
Total
2,492,527
1867
4,653,149,200
According to the nature of intervention, there are two kinds of financing requirements which are those that can yield financial returns and those that are cannot.
For those that can produce financial returns, the total amount of initial investments
is expected to be about US$675 million, while on the other hands, for those yield
no financial returns, but are necessary anyhow to reduce risks so that investments
can be made, the total amount of initial investments is expected to be in approximately of US$615 million. The grand total of both combined initial investments
is US$1.3 billion. Added with recurring annual costs of US$380 million, the total
amount of investments required is about US$1.7 billion.
253
Table 12.3 Cost estimates for restoration of the BRG priority restoration areas (adopted from
Hansson and Dargusch 2018)
BRG Area
classification
Restoration
requirement
Size area (ha) Lowest estimated
cost (US$/ha)
Lowest estimated
total cost (US$)
Licensed
production areas
Hydrological
restoration of
primary,
secondary, or
tertiary canals
1,410,943
2000
2,821,886,000
Non-licensed
product areas
burnt post-2015
Hydrological
restoration of
primary,
secondary, or
tertiary canals
with full
re-vegetation
396,945
3225
1,280,147,625
Protected areas
burnt post-2015
Hydrological
restoration of
commodity to
primary canals
with full
re-vegetation
226,335
1625
367,794,375
Protected areas
with canals
Hydrological
restoration of
commodity to
primary canals
with potential
enrichment
planting
201,457
400
80,582,800
Protected areas
with shallow peat
and canals
Hydrological
restoration of
commodity to
primary canals
with potential
enrichment
planting
256,846
400
102,738,400
Total
2,492,527
1867
4,653,149,200
According to the nature of intervention, there are two kinds of financing requirements which are those that can yield financial returns and those that are cannot.
For those that can produce financial returns, the total amount of initial investments
is expected to be about US$675 million, while on the other hands, for those yield
no financial returns, but are necessary anyhow to reduce risks so that investments
can be made, the total amount of initial investments is expected to be in approximately of US$615 million. The grand total of both combined initial investments
is US$1.3 billion. Added with recurring annual costs of US$380 million, the total
amount of investments required is about US$1.7 billion.