

220
N. Novita et al.
Ecosystem C Stocks
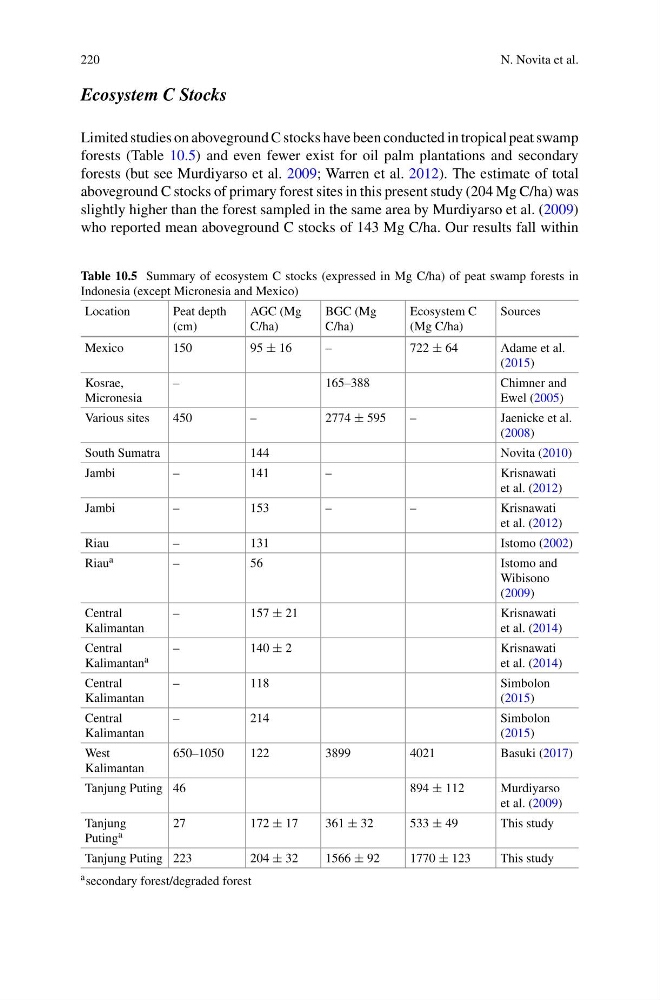
Limited studies on aboveground C stocks have been conducted in tropical peat swamp
forests (Table 10.5) and even fewer exist for oil palm plantations and secondary
forests (but see Murdiyarso et al. 2009; Warren et al. 2012). The estimate of total
aboveground C stocks of primary forest sites in this present study (204 Mg C/ha) was
slightly higher than the forest sampled in the same area by Murdiyarso et al. (2009)
who reported mean aboveground C stocks of 143 Mg C/ha. Our results fall within
Table 10.5 Summary of ecosystem C stocks (expressed in Mg C/ha) of peat swamp forests in
Indonesia (except Micronesia and Mexico)
Location
Peat depth
(cm)
AGC (Mg
C/ha)
BGC (Mg
C/ha)
Ecosystem C
(Mg C/ha)
Sources
Mexico
150
95 ± 16
–
722 ± 64
Adame et al.
(2015)
Kosrae,
Micronesia
–
165–388
Chimner and
Ewel (2005)
Various sites
450
–
2774 ± 595
–
Jaenicke et al.
(2008)
South Sumatra
144
Novita (2010)
Jambi
–
141
–
Krisnawati
et al. (2012)
Jambi
–
153
–
–
Krisnawati
et al. (2012)
Riau
–
131
Istomo (2002)
Riau a
–
56
Istomo and
Wibisono
(2009)
Central
Kalimantan
–
157 ± 21
Krisnawati
et al. (2014)
Central
Kalimantan a
–
140 ± 2
Krisnawati
et al. (2014)
Central
Kalimantan
–
118
Simbolon
(2015)
Central
Kalimantan
–
214
Simbolon
(2015)
West
Kalimantan
650–1050
122
3899
4021
Basuki (2017)
Tanjung Puting 46
894 ± 112
Murdiyarso
et al. (2009)
Tanjung
Puting a
27
172 ± 17
361 ± 32
533 ± 49
This study
Tanjung Puting 223
204 ± 32
1566 ± 92
1770 ± 123
This study
a secondary forest/degraded forest
N. Novita et al.
Ecosystem C Stocks
Limited studies on aboveground C stocks have been conducted in tropical peat swamp
forests (Table 10.5) and even fewer exist for oil palm plantations and secondary
forests (but see Murdiyarso et al. 2009; Warren et al. 2012). The estimate of total
aboveground C stocks of primary forest sites in this present study (204 Mg C/ha) was
slightly higher than the forest sampled in the same area by Murdiyarso et al. (2009)
who reported mean aboveground C stocks of 143 Mg C/ha. Our results fall within
Table 10.5 Summary of ecosystem C stocks (expressed in Mg C/ha) of peat swamp forests in
Indonesia (except Micronesia and Mexico)
Location
Peat depth
(cm)
AGC (Mg
C/ha)
BGC (Mg
C/ha)
Ecosystem C
(Mg C/ha)
Sources
Mexico
150
95 ± 16
–
722 ± 64
Adame et al.
(2015)
Kosrae,
Micronesia
–
165–388
Chimner and
Ewel (2005)
Various sites
450
–
2774 ± 595
–
Jaenicke et al.
(2008)
South Sumatra
144
Novita (2010)
Jambi
–
141
–
Krisnawati
et al. (2012)
Jambi
–
153
–
–
Krisnawati
et al. (2012)
Riau
–
131
Istomo (2002)
Riau a
–
56
Istomo and
Wibisono
(2009)
Central
Kalimantan
–
157 ± 21
Krisnawati
et al. (2014)
Central
Kalimantan a
–
140 ± 2
Krisnawati
et al. (2014)
Central
Kalimantan
–
118
Simbolon
(2015)
Central
Kalimantan
–
214
Simbolon
(2015)
West
Kalimantan
650–1050
122
3899
4021
Basuki (2017)
Tanjung Puting 46
894 ± 112
Murdiyarso
et al. (2009)
Tanjung
Puting a
27
172 ± 17
361 ± 32
533 ± 49
This study
Tanjung Puting 223
204 ± 32
1566 ± 92
1770 ± 123
This study
a secondary forest/degraded forest