

3.7 Sensitivity Analysis
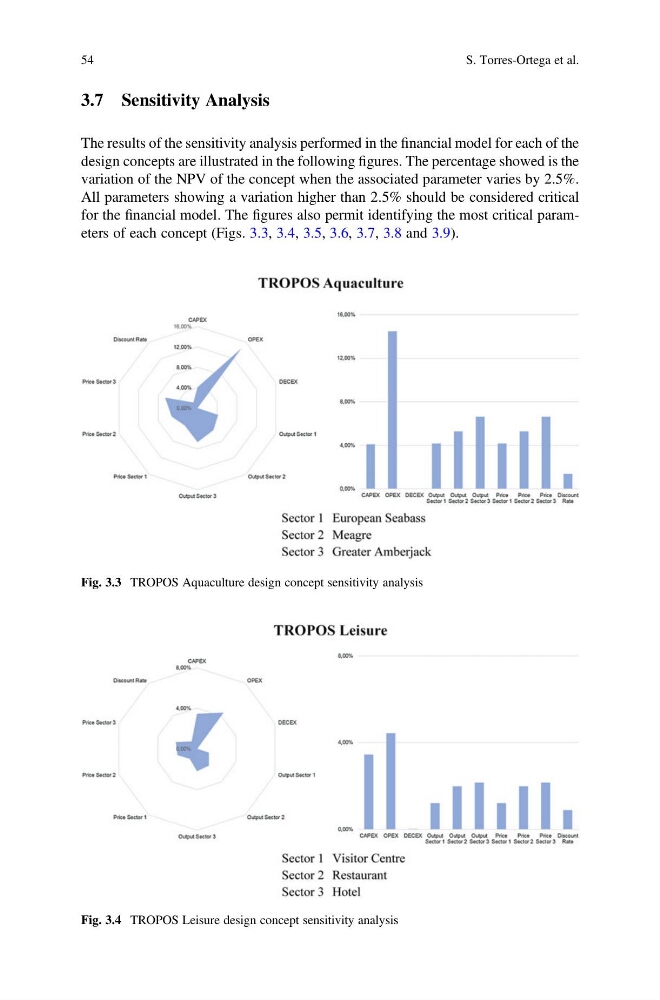
The results of the sensitivity analysis performed in the financial model for each of the
design concepts are illustrated in the following figures. The percentage showed is the
variation of the NPV of the concept when the associated parameter varies by 2.5%.
All parameters showing a variation higher than 2.5% should be considered critical
for the financial model. The figures also permit identifying the most critical parameters of each concept (Figs. 3.3, 3.4, 3.5, 3.6, 3.7, 3.8 and 3.9).
Fig. 3.3 TROPOS Aquaculture design concept sensitivity analysis
Fig. 3.4 TROPOS Leisure design concept sensitivity analysis
54
S. Torres-Ortega et al.
The results of the sensitivity analysis performed in the financial model for each of the
design concepts are illustrated in the following figures. The percentage showed is the
variation of the NPV of the concept when the associated parameter varies by 2.5%.
All parameters showing a variation higher than 2.5% should be considered critical
for the financial model. The figures also permit identifying the most critical parameters of each concept (Figs. 3.3, 3.4, 3.5, 3.6, 3.7, 3.8 and 3.9).
Fig. 3.3 TROPOS Aquaculture design concept sensitivity analysis
Fig. 3.4 TROPOS Leisure design concept sensitivity analysis
54
S. Torres-Ortega et al.