

The main hypothesis and parameters used in this analysis are:
• CAPEX, OPEX, DECEX and revenues data from previous sections.
• An 8.9% is adopted as uniform discount rate for all projects.
• A 4-year period for construction is considered, plus 20 years for operation and
1 year for decommission.
• Construction costs (CAPEX) are distributed in the 4-year period in 10%, 20%,
40% and 30% percentage.
3.6.1 TROPOS Commercial Viability
In Table 3.7 the results of the financial analysis for the four TROPOS designs
(Aquaculture, Leisure, Service hub and Container) are presented. In those involving
different activities, detailed results are also included. Figure 3.1 provides a graphic
summary of the NPV TROPOS design contexts.
Several conclusions arise from the results obtained:
• No design offers financial viability according to their net present values, which
result all negative. The most promising design could be “Leisure”.
• If financial conditions vary and affect the discount rate, the “Container terminal”
design could be profitable if this rate is minimised to 4%. The IRR for the rest of
the designs is not reasonable.
• Although no design presents a positive NPV, the production of greater amberjack
in the “Aquaculture” design is profitable. While negative, the accommodation
module in the “Leisure” design could present easily a positive NPV.
Levelised costs of production for each sector are presented in Table 3.8.
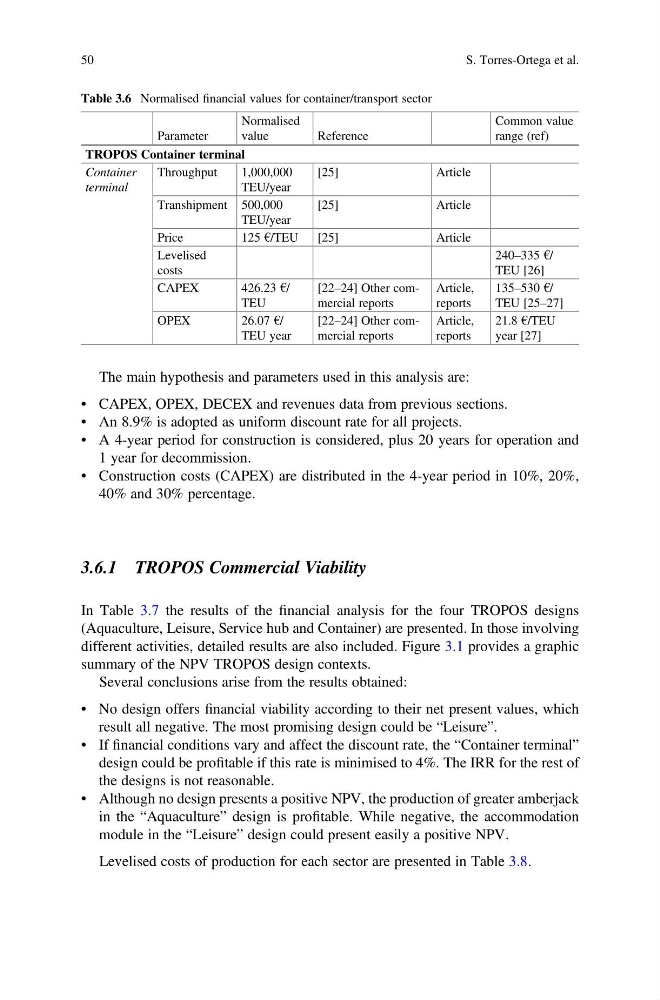
Table 3.6 Normalised financial values for container/transport sector
Parameter
Normalised
value
Reference
Common value
range (ref)
TROPOS Container terminal
Container
terminal
Throughput
1,000,000
TEU/year
[25]
Article
Transhipment 500,000
TEU/year
[25]
Article
Price
125 €/TEU
[25]
Article
Levelised
costs
240–335 €/
TEU [26]
CAPEX
426.23 €/
TEU
[22–24] Other commercial reports
Article,
reports
135–530 €/
TEU [25–27]
OPEX
26.07 €/
TEU year
[22–24] Other commercial reports
Article,
reports
21.8 €/TEU
year [27]
50
S. Torres-Ortega et al.
• CAPEX, OPEX, DECEX and revenues data from previous sections.
• An 8.9% is adopted as uniform discount rate for all projects.
• A 4-year period for construction is considered, plus 20 years for operation and
1 year for decommission.
• Construction costs (CAPEX) are distributed in the 4-year period in 10%, 20%,
40% and 30% percentage.
3.6.1 TROPOS Commercial Viability
In Table 3.7 the results of the financial analysis for the four TROPOS designs
(Aquaculture, Leisure, Service hub and Container) are presented. In those involving
different activities, detailed results are also included. Figure 3.1 provides a graphic
summary of the NPV TROPOS design contexts.
Several conclusions arise from the results obtained:
• No design offers financial viability according to their net present values, which
result all negative. The most promising design could be “Leisure”.
• If financial conditions vary and affect the discount rate, the “Container terminal”
design could be profitable if this rate is minimised to 4%. The IRR for the rest of
the designs is not reasonable.
• Although no design presents a positive NPV, the production of greater amberjack
in the “Aquaculture” design is profitable. While negative, the accommodation
module in the “Leisure” design could present easily a positive NPV.
Levelised costs of production for each sector are presented in Table 3.8.
Table 3.6 Normalised financial values for container/transport sector
Parameter
Normalised
value
Reference
Common value
range (ref)
TROPOS Container terminal
Container
terminal
Throughput
1,000,000
TEU/year
[25]
Article
Transhipment 500,000
TEU/year
[25]
Article
Price
125 €/TEU
[25]
Article
Levelised
costs
240–335 €/
TEU [26]
CAPEX
426.23 €/
TEU
[22–24] Other commercial reports
Article,
reports
135–530 €/
TEU [25–27]
OPEX
26.07 €/
TEU year
[22–24] Other commercial reports
Article,
reports
21.8 €/TEU
year [27]
50
S. Torres-Ortega et al.