

Other types of pollution, including spills of hazardous and noxious substances,
remain a concern.
10.4 New Challenges to Sustainable Shipping
10.4.1 Heavy Reliance on Oil for Propulsion
The transport sector accounts for more than 50% of oil demand today. Over half of
the increase in freight transport energy projected by 2040 can be attributed to
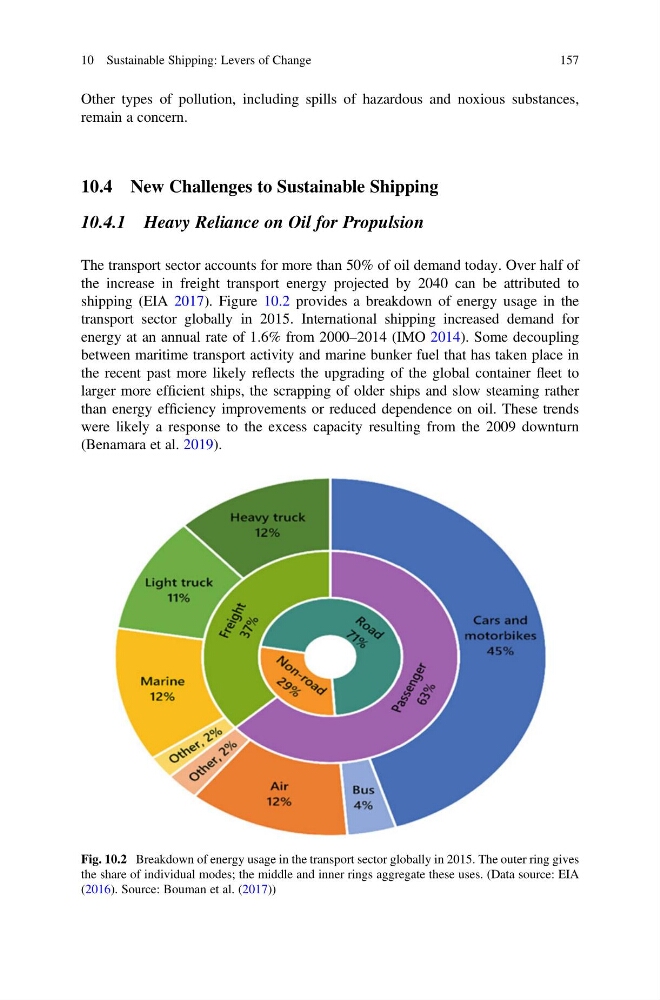
shipping (EIA 2017). Figure 10.2 provides a breakdown of energy usage in the
transport sector globally in 2015. International shipping increased demand for
energy at an annual rate of 1.6% from 2000–2014 (IMO 2014). Some decoupling
between maritime transport activity and marine bunker fuel that has taken place in
the recent past more likely reflects the upgrading of the global container fleet to
larger more efficient ships, the scrapping of older ships and slow steaming rather
than energy efficiency improvements or reduced dependence on oil. These trends
were likely a response to the excess capacity resulting from the 2009 downturn
(Benamara et al. 2019).
Fig. 10.2 Breakdown of energy usage in the transport sector globally in 2015. The outer ring gives
the share of individual modes; the middle and inner rings aggregate these uses. (Data source: EIA
(2016). Source: Bouman et al. (2017))
10 Sustainable Shipping: Levers of Change
157
remain a concern.
10.4 New Challenges to Sustainable Shipping
10.4.1 Heavy Reliance on Oil for Propulsion
The transport sector accounts for more than 50% of oil demand today. Over half of
the increase in freight transport energy projected by 2040 can be attributed to
shipping (EIA 2017). Figure 10.2 provides a breakdown of energy usage in the
transport sector globally in 2015. International shipping increased demand for
energy at an annual rate of 1.6% from 2000–2014 (IMO 2014). Some decoupling
between maritime transport activity and marine bunker fuel that has taken place in
the recent past more likely reflects the upgrading of the global container fleet to
larger more efficient ships, the scrapping of older ships and slow steaming rather
than energy efficiency improvements or reduced dependence on oil. These trends
were likely a response to the excess capacity resulting from the 2009 downturn
(Benamara et al. 2019).
Fig. 10.2 Breakdown of energy usage in the transport sector globally in 2015. The outer ring gives
the share of individual modes; the middle and inner rings aggregate these uses. (Data source: EIA
(2016). Source: Bouman et al. (2017))
10 Sustainable Shipping: Levers of Change
157