

7.7 Summary
This chapter shows the quantitative analysis of the data
obtained from the survey questionnaire. This chapter
started with descriptive analysis, data normality tests,
reliability tests, and validity tests. This chapter also
included EFA and CFA tests for all individual constructs
and then the overall model. The statistics of CFA show
goodness of fit model. Finally, the structural path model
was executed. In this chapter, moderation tests (of age,
experience, and cultural dimension) were also executed to
the impact of moderators on the relationship between
dependent variables and behavioral intention to use LMS
technology.
References
Anderson, J., & Gerbing, D. (1988). Structural equation modeling in
practice: A review and recommended two-step approach. Psy- Chol
Bull, 103, 411–423.
Azzalini, A., & Capitanio., A. (1999). Statistical applications of the
multivariate skew normal distribution. Journal of the Royal
Statistical Society: Series B (Statistical Methodology), 61(3), 579–
602. http://www.jstor.org/stable/2680724?seq=1#page_scan_tab_
contents.
Bagozzi, R. P., Yi, Y. P. L. (1991). Assessing construct validity in
organizational research. Admin Sci Q, 36(421–58).
Baumgartner, H., & Homburg, C. (1996). Applications of structural
equation modeling in marketing and consumer research. A Review’,
International Journal of Research in Marketing, 13, 139–161.
Bentler, P. (1990). Comparative fit indexes in structural models.
Psychological Bulletin, 107, 238–246.
Blunch, N. J. (2013). Introduction to structural equation modeling
using IBM SPSS statistics and amos. SAGE Publications.
Byrne, B. M. (2010). Structural equation modeling with amos: Basic
concepts, applications, and programming (2nd ed.). Taylor and
Francis Group.
Cattell, R. B. (1966). The scree test for the number of factors.
Multivariate Behavioral Research, 1(2), 245–276.
Field, A. (2009). Discovering statistics using SPSS. Sage publications.
Fındık, D., & Özkan, S. (2010). Identifying success factors for WBLMS
use by instructors of engineering departments (pp. 1–7).
Gaskin, J. (2012). Stats Wiki and Stats tools package. http://statwiki.
kolobkreations.com/.
George, D., & Mallery, P. (2003). SPSS for windows step by step: A
simple guide and reference (4th ed.). Allyn and Bacon.
Green, S. B., & Salkind. (2005). Salkind. Using SPSS for windows and
macintosh. Prentice Hall.
Hair, J. F., Black, W. C., Babin, B. J., & Anderson, R. E. (2010).
Multivariate data analysis: A global perspective. Basım: Pearson
Education Inc.
Hussain, M., Khan, M., & Al-Aomar, R. (2016). A framework for
supply chain sustainability in service industry with confirmatory
factor analysis. Renewable and Sustainable Energy Reviews, 55,
1301–1312. https://doi.org/10.1016/j.rser.2015.07.097.
Im, Il Hong, & Seongtae Kang, M. S. (2011). An international
comparison of technology adoption testing the UTAUT model.
Information and Management, 48(1), 1–8. https://doi.org/10.1016/j.
im.2010.09.001.
Jöreskog, K. G., & Sörbom, D. (1981). LISREL V: Analysis of linear
structural relations by the method of maximum likelihood. International Educational Services.
Klem, L. (2000). Structural equation modeling.
McCullough, J. & Best, R. (1979). Conjoint measurement: Temporal
stability and structural reliability. Journal of Marketing Research,
26–31.
Osborne, J. W., & Overbay, A. (2004). The power of outliers (and why
researchers should always check for them). Practi. Practical
Assessment, Research and Evaluation, 9(6), 1–12. http://
pareonline.net/getvn.asp?v=9&n=6+.
Pallant, J. (2013). SPSS survival manual. McGraw-Hill Education.
Peter, J. P. (1979). Reliability: A review of psychometric basics and
recent marketing practices. Journal of Marketing Research, 6–17.
Podsakoff, P. M., MacKenzie, S. B., Lee, J. Y., & Podsakoff, N.
P. (2003). Common method biases in behavioral research: A critical
review of the literature and recommended remedies. Journal of
Applied Psychology, 88(5), 879–903.
Podsakoff, P. M., & Organ, D. W. (1986). Self-reports in organizational
research: Problems and prospects. Journal of Management, 12(4),
531–544.
Ritter, G., & Gallegos, M. (1997). Outliers in statistical pattern
recognition and an application to automatic chromosome classification. Pattern Recognition Letters, 18(6), 525–539. https://doi.org/
10.1016/S0167-8655(97)00049-4.
Steiger, J. H. (1990). Structural model evaluation and modification: An
interval estimation approach. Multivariate Behavioral Research, 21,
309–331.
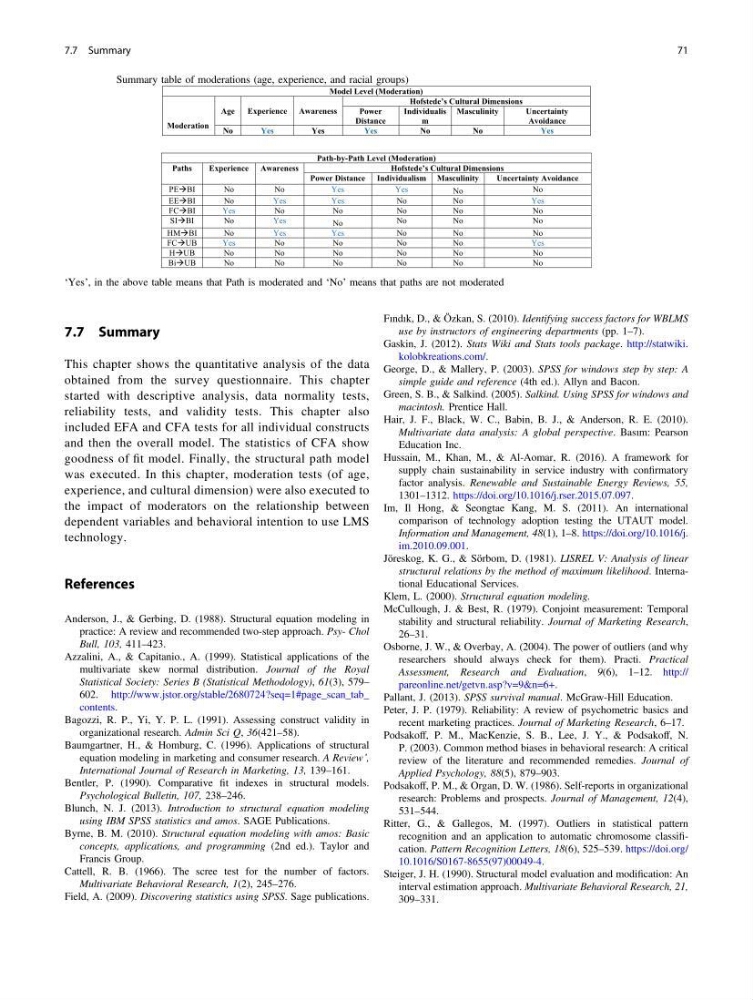
Table 7.8 Summary table of moderations (age, experience, and racial groups)
Model Level (Moderation)
Moderation
Age
Experience Awareness
Hofstede’s Cultural Dimensions
Power
Distance
Individualis
m
Masculinity
Uncertainty
Avoidance
No
Yes
Yes
Yes
No
No
Yes
Path-by-Path Level (Moderation)
Paths
Experience Awareness
Hofstede’s Cultural Dimensions
Power Distance Individualism Masculinity
Uncertainty Avoidance
PEBI
No
No
Yes
Yes
No
No
EEBI
No
Yes
Yes
No
No
Yes
FC
Yes
No
No
No
No
No
SIBI
No
Yes
No
No
No
No
HMBI
No
Yes
Yes
No
No
No
FCUB
Yes
No
No
No
No
Yes
HUB
No
No
No
No
No
No
BiUB
No
No
No
No
No
No
‘Yes’, in the above table means that Path is moderated and ‘No’ means that paths are not moderated
7.7 Summary
71
This chapter shows the quantitative analysis of the data
obtained from the survey questionnaire. This chapter
started with descriptive analysis, data normality tests,
reliability tests, and validity tests. This chapter also
included EFA and CFA tests for all individual constructs
and then the overall model. The statistics of CFA show
goodness of fit model. Finally, the structural path model
was executed. In this chapter, moderation tests (of age,
experience, and cultural dimension) were also executed to
the impact of moderators on the relationship between
dependent variables and behavioral intention to use LMS
technology.
References
Anderson, J., & Gerbing, D. (1988). Structural equation modeling in
practice: A review and recommended two-step approach. Psy- Chol
Bull, 103, 411–423.
Azzalini, A., & Capitanio., A. (1999). Statistical applications of the
multivariate skew normal distribution. Journal of the Royal
Statistical Society: Series B (Statistical Methodology), 61(3), 579–
602. http://www.jstor.org/stable/2680724?seq=1#page_scan_tab_
contents.
Bagozzi, R. P., Yi, Y. P. L. (1991). Assessing construct validity in
organizational research. Admin Sci Q, 36(421–58).
Baumgartner, H., & Homburg, C. (1996). Applications of structural
equation modeling in marketing and consumer research. A Review’,
International Journal of Research in Marketing, 13, 139–161.
Bentler, P. (1990). Comparative fit indexes in structural models.
Psychological Bulletin, 107, 238–246.
Blunch, N. J. (2013). Introduction to structural equation modeling
using IBM SPSS statistics and amos. SAGE Publications.
Byrne, B. M. (2010). Structural equation modeling with amos: Basic
concepts, applications, and programming (2nd ed.). Taylor and
Francis Group.
Cattell, R. B. (1966). The scree test for the number of factors.
Multivariate Behavioral Research, 1(2), 245–276.
Field, A. (2009). Discovering statistics using SPSS. Sage publications.
Fındık, D., & Özkan, S. (2010). Identifying success factors for WBLMS
use by instructors of engineering departments (pp. 1–7).
Gaskin, J. (2012). Stats Wiki and Stats tools package. http://statwiki.
kolobkreations.com/.
George, D., & Mallery, P. (2003). SPSS for windows step by step: A
simple guide and reference (4th ed.). Allyn and Bacon.
Green, S. B., & Salkind. (2005). Salkind. Using SPSS for windows and
macintosh. Prentice Hall.
Hair, J. F., Black, W. C., Babin, B. J., & Anderson, R. E. (2010).
Multivariate data analysis: A global perspective. Basım: Pearson
Education Inc.
Hussain, M., Khan, M., & Al-Aomar, R. (2016). A framework for
supply chain sustainability in service industry with confirmatory
factor analysis. Renewable and Sustainable Energy Reviews, 55,
1301–1312. https://doi.org/10.1016/j.rser.2015.07.097.
Im, Il Hong, & Seongtae Kang, M. S. (2011). An international
comparison of technology adoption testing the UTAUT model.
Information and Management, 48(1), 1–8. https://doi.org/10.1016/j.
im.2010.09.001.
Jöreskog, K. G., & Sörbom, D. (1981). LISREL V: Analysis of linear
structural relations by the method of maximum likelihood. International Educational Services.
Klem, L. (2000). Structural equation modeling.
McCullough, J. & Best, R. (1979). Conjoint measurement: Temporal
stability and structural reliability. Journal of Marketing Research,
26–31.
Osborne, J. W., & Overbay, A. (2004). The power of outliers (and why
researchers should always check for them). Practi. Practical
Assessment, Research and Evaluation, 9(6), 1–12. http://
pareonline.net/getvn.asp?v=9&n=6+.
Pallant, J. (2013). SPSS survival manual. McGraw-Hill Education.
Peter, J. P. (1979). Reliability: A review of psychometric basics and
recent marketing practices. Journal of Marketing Research, 6–17.
Podsakoff, P. M., MacKenzie, S. B., Lee, J. Y., & Podsakoff, N.
P. (2003). Common method biases in behavioral research: A critical
review of the literature and recommended remedies. Journal of
Applied Psychology, 88(5), 879–903.
Podsakoff, P. M., & Organ, D. W. (1986). Self-reports in organizational
research: Problems and prospects. Journal of Management, 12(4),
531–544.
Ritter, G., & Gallegos, M. (1997). Outliers in statistical pattern
recognition and an application to automatic chromosome classification. Pattern Recognition Letters, 18(6), 525–539. https://doi.org/
10.1016/S0167-8655(97)00049-4.
Steiger, J. H. (1990). Structural model evaluation and modification: An
interval estimation approach. Multivariate Behavioral Research, 21,
309–331.
Table 7.8 Summary table of moderations (age, experience, and racial groups)
Model Level (Moderation)
Moderation
Age
Experience Awareness
Hofstede’s Cultural Dimensions
Power
Distance
Individualis
m
Masculinity
Uncertainty
Avoidance
No
Yes
Yes
Yes
No
No
Yes
Path-by-Path Level (Moderation)
Paths
Experience Awareness
Hofstede’s Cultural Dimensions
Power Distance Individualism Masculinity
Uncertainty Avoidance
PEBI
No
No
Yes
Yes
No
No
EEBI
No
Yes
Yes
No
No
Yes
FC
Yes
No
No
No
No
No
SIBI
No
Yes
No
No
No
No
HMBI
No
Yes
Yes
No
No
No
FCUB
Yes
No
No
No
No
Yes
HUB
No
No
No
No
No
No
BiUB
No
No
No
No
No
No
‘Yes’, in the above table means that Path is moderated and ‘No’ means that paths are not moderated
7.7 Summary
71