

n’ Adjusted minimum sample size = ?
Substituting these values in the formulae we get:
Step 1 : n ¼
1:96
ð
Þ
2 Â 58
ð Þ Â 100 À 58
ð
Þ
5
ð Þ
2
¼ 374:32
Step 2 : n
0
¼
374:32
1 þ
374:32
2005
¼ 315:6
Hence, the approximate sample size for this study is 316.
The following Table (6.3) by Krejcie and Morgan (1970)
indicates that the sample size for a total population of 2000,
is 322.
Similarly, the sample size found for a total population of
2005, using online sampling calculator (available at http://
www.surveysystem.com/sscalc.htm),
online-calculator
(available at http://fluidsurveys.com/survey-sample-sizecalculator/) and, online-calculator (available at http://www.
raosoft.com/samplesize.html) with a confidence level of
95% and a confidence interval of 5%, the sampling size is
323. Hence the researcher is confident about the sample size.
6.5 Quantitative Data Collection
and Analysis
In this research, various primary and secondary sources were
used for data collection. A survey questionnaire was the
primary source of quantitative data collection. The review of
the literature was a source of secondary data. Some
second-hand data, such as data regarding the total number of
instructors, and an approximate number of instructors using
LMS was collected from different institutions. For instance,
https://www.mohe.gov.sa/en/default.aspx, and http://www.
citc.gov.sa were used for secondary data.
The survey instrument was divided into three sections and
included questions on demography, questions on the core
constructs of the UTAUT2 model and questions on the
moderating variables of the model. According to Bell (1999)
“the questionnaire is a widely used and useful instrument for
collecting survey information providing structured, often
numerical data, being able to be administered without the
presence of the researcher, and often being comparatively
straightforward to analyze” (p. 245). The questionnaire was
designed with a five-point Likert scale from 1 (strongly
disagree: lowest rating) to 5 (strongly agree: highest rating)
to identify the adoption of LMS technology by instructors to
get numeric results for statistical analysis. Five-point Likert
scales were selected to offer the freedom to indicate the
applicable rating for their situation. In most cases this scale
has the ranges: strongly disagree (1), disagree (2), neutral
(3), agree (4) and strongly agree (5). In this study, a survey
instrument was adapted from Venkatesh, Morris, Davis and
Davis (2003), Venkatesh, Thong and Xu 2012) and many
other researchers who have used the UTAUT2 model in their
Table 6.2 Target population
Institution name
No of instructors
King Fahd University of Petroleum and Minerals (KFUPM)
910
Dammam Community College (DCC)
40
Hafr Al-Batin Community College (HBCC)
37
Prince Mohammad University (PMU)
153
Dammam University (DU)
305
Jubail University College (JUC)
225
King Faisal University (KFU)
230
Al-Kharj University (KU)
105
Total number of instructors
2005
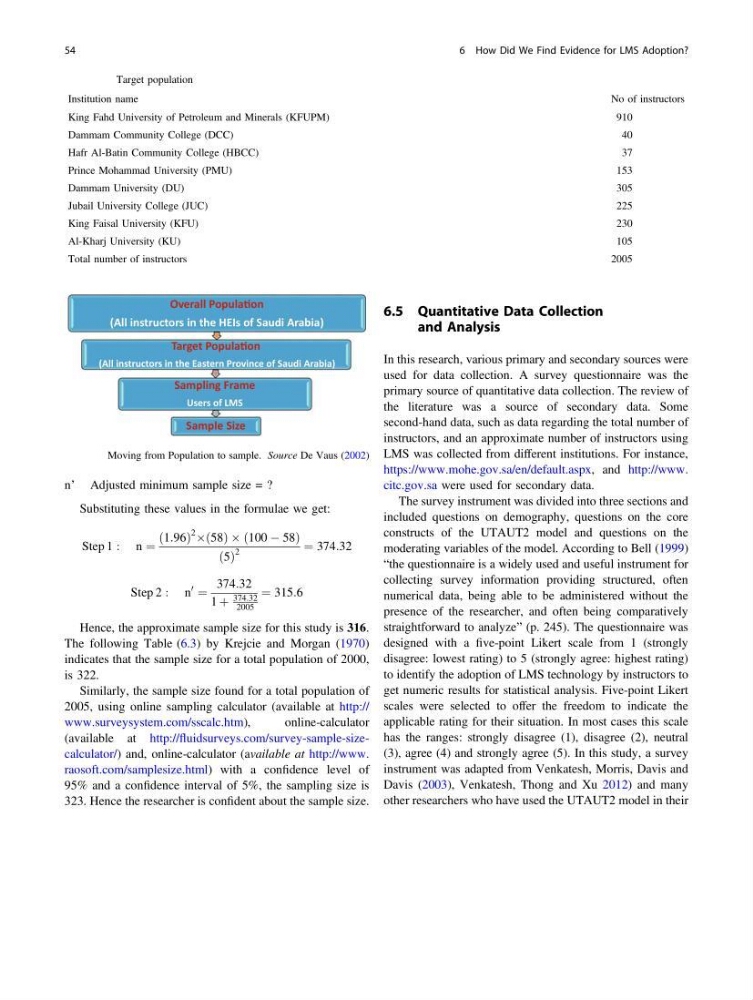
Overall PopulaƟon
(All instructors in the HEIs of Saudi Arabia)
Target PopulaƟon
(All instructors in the Eastern Province of Saudi Arabia)
Sampling Frame
Users of LMS
Sample Size
Fig. 6.2 Moving from Population to sample. Source De Vaus (2002)
54
6 How Did We Find Evidence for LMS Adoption?
Substituting these values in the formulae we get:
Step 1 : n ¼
1:96
ð
Þ
2 Â 58
ð Þ Â 100 À 58
ð
Þ
5
ð Þ
2
¼ 374:32
Step 2 : n
0
¼
374:32
1 þ
374:32
2005
¼ 315:6
Hence, the approximate sample size for this study is 316.
The following Table (6.3) by Krejcie and Morgan (1970)
indicates that the sample size for a total population of 2000,
is 322.
Similarly, the sample size found for a total population of
2005, using online sampling calculator (available at http://
www.surveysystem.com/sscalc.htm),
online-calculator
(available at http://fluidsurveys.com/survey-sample-sizecalculator/) and, online-calculator (available at http://www.
raosoft.com/samplesize.html) with a confidence level of
95% and a confidence interval of 5%, the sampling size is
323. Hence the researcher is confident about the sample size.
6.5 Quantitative Data Collection
and Analysis
In this research, various primary and secondary sources were
used for data collection. A survey questionnaire was the
primary source of quantitative data collection. The review of
the literature was a source of secondary data. Some
second-hand data, such as data regarding the total number of
instructors, and an approximate number of instructors using
LMS was collected from different institutions. For instance,
https://www.mohe.gov.sa/en/default.aspx, and http://www.
citc.gov.sa were used for secondary data.
The survey instrument was divided into three sections and
included questions on demography, questions on the core
constructs of the UTAUT2 model and questions on the
moderating variables of the model. According to Bell (1999)
“the questionnaire is a widely used and useful instrument for
collecting survey information providing structured, often
numerical data, being able to be administered without the
presence of the researcher, and often being comparatively
straightforward to analyze” (p. 245). The questionnaire was
designed with a five-point Likert scale from 1 (strongly
disagree: lowest rating) to 5 (strongly agree: highest rating)
to identify the adoption of LMS technology by instructors to
get numeric results for statistical analysis. Five-point Likert
scales were selected to offer the freedom to indicate the
applicable rating for their situation. In most cases this scale
has the ranges: strongly disagree (1), disagree (2), neutral
(3), agree (4) and strongly agree (5). In this study, a survey
instrument was adapted from Venkatesh, Morris, Davis and
Davis (2003), Venkatesh, Thong and Xu 2012) and many
other researchers who have used the UTAUT2 model in their
Table 6.2 Target population
Institution name
No of instructors
King Fahd University of Petroleum and Minerals (KFUPM)
910
Dammam Community College (DCC)
40
Hafr Al-Batin Community College (HBCC)
37
Prince Mohammad University (PMU)
153
Dammam University (DU)
305
Jubail University College (JUC)
225
King Faisal University (KFU)
230
Al-Kharj University (KU)
105
Total number of instructors
2005
Overall PopulaƟon
(All instructors in the HEIs of Saudi Arabia)
Target PopulaƟon
(All instructors in the Eastern Province of Saudi Arabia)
Sampling Frame
Users of LMS
Sample Size
Fig. 6.2 Moving from Population to sample. Source De Vaus (2002)
54
6 How Did We Find Evidence for LMS Adoption?