

emissions from driving of 2,408 tonnes per
month or 28,903 tonnes per year (Figs. 36, 37).
Moreover, the project saved 0.956 kg of NO x
on average per month, amounting to 22.9 kg
over the two years of its duration, as well as
0.220 kg of SO x per month on average (5.3 kg
over the two years) and 0.191 kg of PM2.5 per
month on average (4.6 kg over the two years).
The project’s demand response products
include SMART Shift, SMART Shift Plus and
SMART Choice. SMART Shift and SMART
Shift Plus provide users with electricity price
information for different time periods in power
supply contracts. SMART Choice provides users
with quasi real-time electricity price information
that is updated every 5 min to guide users’ power
consumption behaviour. Demand response plays
an active role in reducing energy consumption
and fossil fuel emissions and in peak load
shaving.
As shown in Fig. 38, SMART Shift and
SMART Shift Plus users consume less power
and emit less CO 2 . Calculation
35 results show
that under these three modes, nearly 196 tonnes
of CO 2 could be reduced.
Figure 39 shows that SMART Shift and
SMART Shift Plus users consume less power
and reduce their emissions of SO x , NO x and
PM2.5 by about 749 kg, 335 kg and 284 kg
respectively.
2. Sino-Singapore Tianjin Eco-City Smart Grid
demonstration project
The project comprises distributed power generation, microgrids and energy storage systems,
intelligent substations, power distribution automation, equipment status and power quality monitoring systems, visualisation platform, power
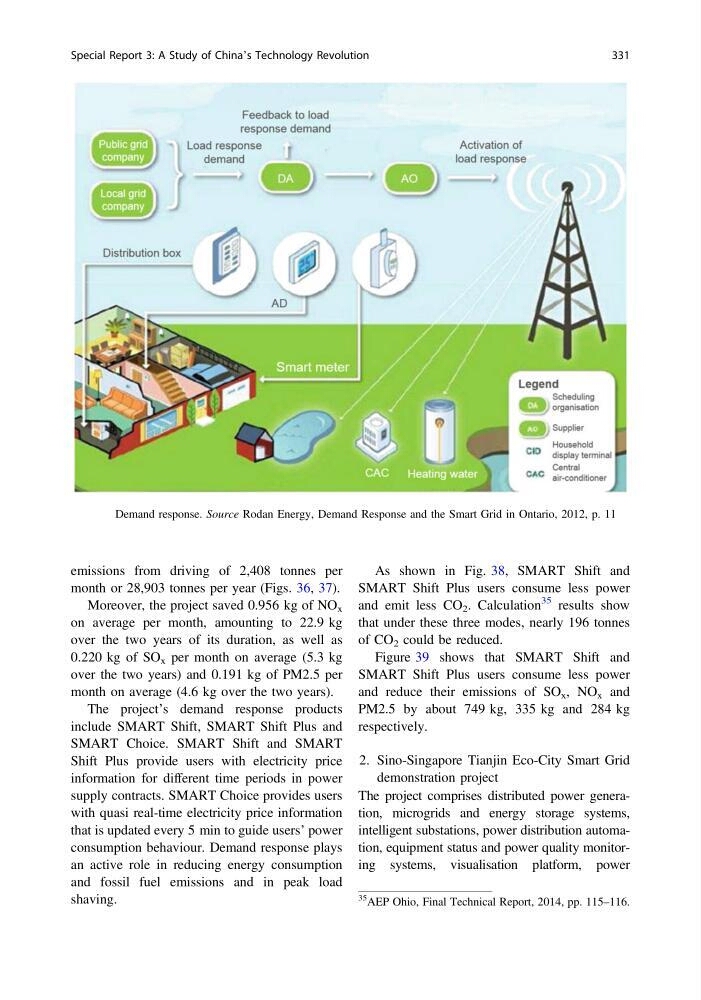
Fig. 34 Demand response. Source Rodan Energy, Demand Response and the Smart Grid in Ontario, 2012, p. 11
35
AEP Ohio, Final Technical Report, 2014, pp. 115–116.
Special Report 3: A Study of China’s Technology Revolution
331
month or 28,903 tonnes per year (Figs. 36, 37).
Moreover, the project saved 0.956 kg of NO x
on average per month, amounting to 22.9 kg
over the two years of its duration, as well as
0.220 kg of SO x per month on average (5.3 kg
over the two years) and 0.191 kg of PM2.5 per
month on average (4.6 kg over the two years).
The project’s demand response products
include SMART Shift, SMART Shift Plus and
SMART Choice. SMART Shift and SMART
Shift Plus provide users with electricity price
information for different time periods in power
supply contracts. SMART Choice provides users
with quasi real-time electricity price information
that is updated every 5 min to guide users’ power
consumption behaviour. Demand response plays
an active role in reducing energy consumption
and fossil fuel emissions and in peak load
shaving.
As shown in Fig. 38, SMART Shift and
SMART Shift Plus users consume less power
and emit less CO 2 . Calculation
35 results show
that under these three modes, nearly 196 tonnes
of CO 2 could be reduced.
Figure 39 shows that SMART Shift and
SMART Shift Plus users consume less power
and reduce their emissions of SO x , NO x and
PM2.5 by about 749 kg, 335 kg and 284 kg
respectively.
2. Sino-Singapore Tianjin Eco-City Smart Grid
demonstration project
The project comprises distributed power generation, microgrids and energy storage systems,
intelligent substations, power distribution automation, equipment status and power quality monitoring systems, visualisation platform, power
Fig. 34 Demand response. Source Rodan Energy, Demand Response and the Smart Grid in Ontario, 2012, p. 11
35
AEP Ohio, Final Technical Report, 2014, pp. 115–116.
Special Report 3: A Study of China’s Technology Revolution
331