

size of that reduction will be closely related to
price trends in the carbon market.
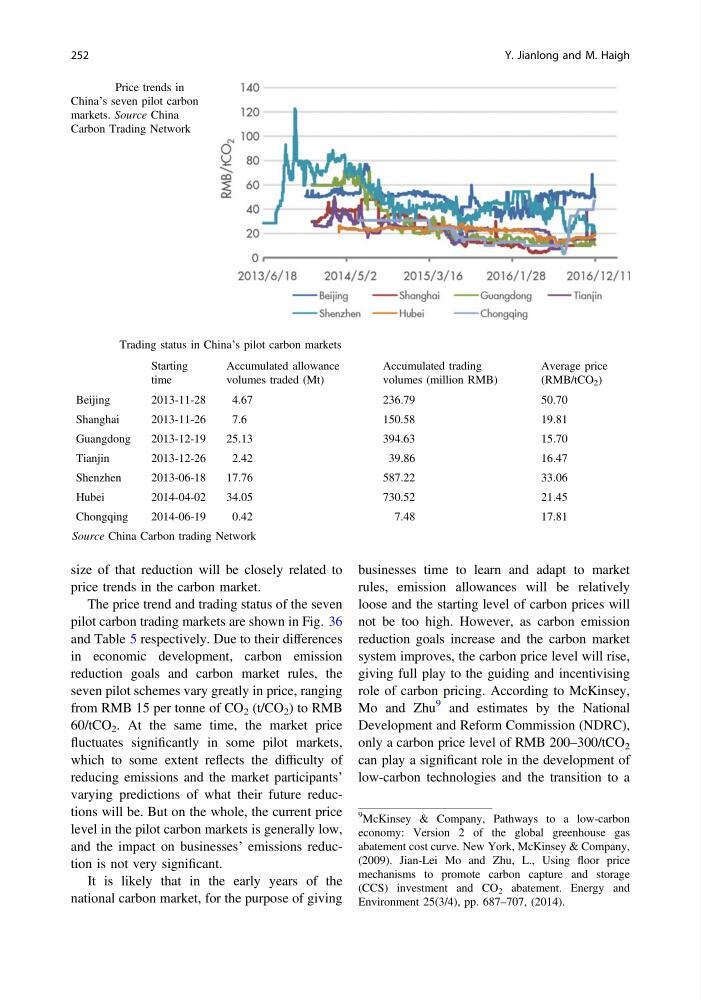
The price trend and trading status of the seven
pilot carbon trading markets are shown in Fig. 36
and Table 5 respectively. Due to their differences
in economic development, carbon emission
reduction goals and carbon market rules, the
seven pilot schemes vary greatly in price, ranging
from RMB 15 per tonne of CO 2 (t/CO 2 ) to RMB
60/tCO 2 . At the same time, the market price
fluctuates significantly in some pilot markets,
which to some extent reflects the difficulty of
reducing emissions and the market participants’
varying predictions of what their future reductions will be. But on the whole, the current price
level in the pilot carbon markets is generally low,
and the impact on businesses’ emissions reduction is not very significant.
It is likely that in the early years of the
national carbon market, for the purpose of giving
businesses time to learn and adapt to market
rules, emission allowances will be relatively
loose and the starting level of carbon prices will
not be too high. However, as carbon emission
reduction goals increase and the carbon market
system improves, the carbon price level will rise,
giving full play to the guiding and incentivising
role of carbon pricing. According to McKinsey,
Mo and Zhu
9 and estimates by the National
Development and Reform Commission (NDRC),
only a carbon price level of RMB 200–300/tCO 2
can play a significant role in the development of
low-carbon technologies and the transition to a
Fig. 36 Price trends in
China’s seven pilot carbon
markets. Source China
Carbon Trading Network
Table 5 Trading status in China’s pilot carbon markets
Starting
time
Accumulated allowance
volumes traded (Mt)
Accumulated trading
volumes (million RMB)
Average price
(RMB/tCO 2 )
Beijing
2013-11-28
4.67
236.79
50.70
Shanghai
2013-11-26
7.6
150.58
19.81
Guangdong
2013-12-19
25.13
394.63
15.70
Tianjin
2013-12-26
2.42
39.86
16.47
Shenzhen
2013-06-18
17.76
587.22
33.06
Hubei
2014-04-02
34.05
730.52
21.45
Chongqing
2014-06-19
0.42
7.48
17.81
Source China Carbon trading Network
9
McKinsey & Company, Pathways to a low-carbon
economy: Version 2 of the global greenhouse gas
abatement cost curve. New York, McKinsey & Company,
(2009). Jian-Lei Mo and Zhu, L., Using floor price
mechanisms to promote carbon capture and storage
(CCS) investment and CO 2 abatement. Energy and
Environment 25(3/4), pp. 687–707, (2014).
252
Y. Jianlong and M. Haigh
price trends in the carbon market.
The price trend and trading status of the seven
pilot carbon trading markets are shown in Fig. 36
and Table 5 respectively. Due to their differences
in economic development, carbon emission
reduction goals and carbon market rules, the
seven pilot schemes vary greatly in price, ranging
from RMB 15 per tonne of CO 2 (t/CO 2 ) to RMB
60/tCO 2 . At the same time, the market price
fluctuates significantly in some pilot markets,
which to some extent reflects the difficulty of
reducing emissions and the market participants’
varying predictions of what their future reductions will be. But on the whole, the current price
level in the pilot carbon markets is generally low,
and the impact on businesses’ emissions reduction is not very significant.
It is likely that in the early years of the
national carbon market, for the purpose of giving
businesses time to learn and adapt to market
rules, emission allowances will be relatively
loose and the starting level of carbon prices will
not be too high. However, as carbon emission
reduction goals increase and the carbon market
system improves, the carbon price level will rise,
giving full play to the guiding and incentivising
role of carbon pricing. According to McKinsey,
Mo and Zhu
9 and estimates by the National
Development and Reform Commission (NDRC),
only a carbon price level of RMB 200–300/tCO 2
can play a significant role in the development of
low-carbon technologies and the transition to a
Fig. 36 Price trends in
China’s seven pilot carbon
markets. Source China
Carbon Trading Network
Table 5 Trading status in China’s pilot carbon markets
Starting
time
Accumulated allowance
volumes traded (Mt)
Accumulated trading
volumes (million RMB)
Average price
(RMB/tCO 2 )
Beijing
2013-11-28
4.67
236.79
50.70
Shanghai
2013-11-26
7.6
150.58
19.81
Guangdong
2013-12-19
25.13
394.63
15.70
Tianjin
2013-12-26
2.42
39.86
16.47
Shenzhen
2013-06-18
17.76
587.22
33.06
Hubei
2014-04-02
34.05
730.52
21.45
Chongqing
2014-06-19
0.42
7.48
17.81
Source China Carbon trading Network
9
McKinsey & Company, Pathways to a low-carbon
economy: Version 2 of the global greenhouse gas
abatement cost curve. New York, McKinsey & Company,
(2009). Jian-Lei Mo and Zhu, L., Using floor price
mechanisms to promote carbon capture and storage
(CCS) investment and CO 2 abatement. Energy and
Environment 25(3/4), pp. 687–707, (2014).
252
Y. Jianlong and M. Haigh