

in industry and transport by replacing conventional fossil fuels with biomass and hydrogen and
by developing and deploying carbon capture,
utilisation and storage technologies.
Currently, China is substituting oil and gas for
coal, and non-fossil fuels for fossil fuels. In 2016,
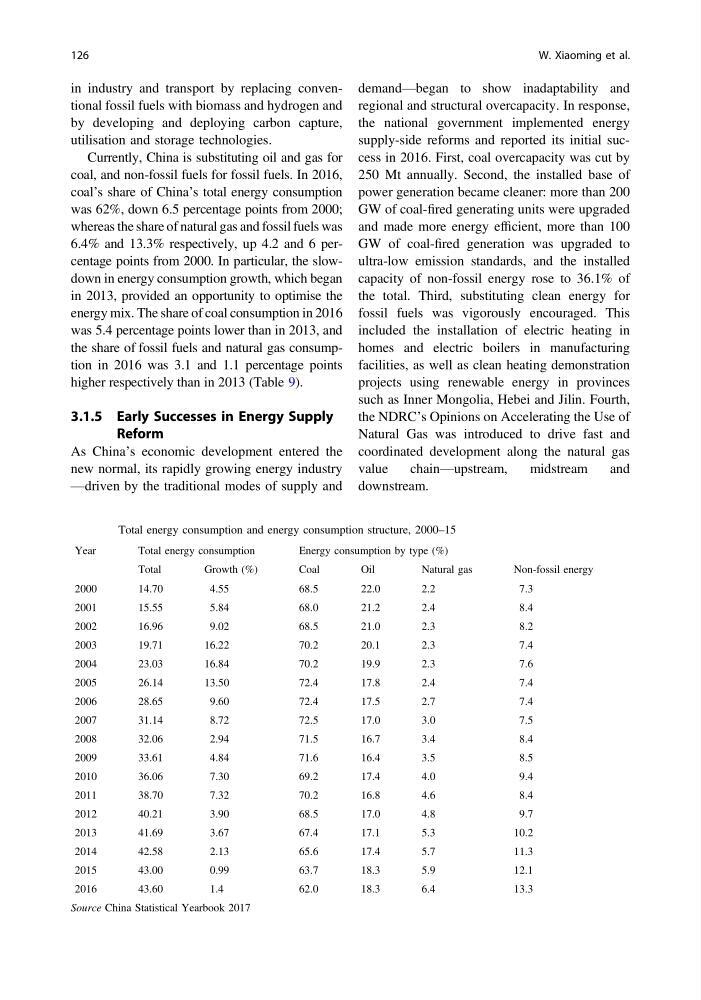
coal’s share of China’s total energy consumption
was 62%, down 6.5 percentage points from 2000;
whereas the share of natural gas and fossil fuels was
6.4% and 13.3% respectively, up 4.2 and 6 percentage points from 2000. In particular, the slowdown in energy consumption growth, which began
in 2013, provided an opportunity to optimise the
energy mix. The share of coal consumption in 2016
was 5.4 percentage points lower than in 2013, and
the share of fossil fuels and natural gas consumption in 2016 was 3.1 and 1.1 percentage points
higher respectively than in 2013 (Table 9).
3.1.5 Early Successes in Energy Supply
Reform
As China’s economic development entered the
new normal, its rapidly growing energy industry
—driven by the traditional modes of supply and
demand—began to show inadaptability and
regional and structural overcapacity. In response,
the national government implemented energy
supply-side reforms and reported its initial success in 2016. First, coal overcapacity was cut by
250 Mt annually. Second, the installed base of
power generation became cleaner: more than 200
GW of coal-fired generating units were upgraded
and made more energy efficient, more than 100
GW of coal-fired generation was upgraded to
ultra-low emission standards, and the installed
capacity of non-fossil energy rose to 36.1% of
the total. Third, substituting clean energy for
fossil fuels was vigorously encouraged. This
included the installation of electric heating in
homes and electric boilers in manufacturing
facilities, as well as clean heating demonstration
projects using renewable energy in provinces
such as Inner Mongolia, Hebei and Jilin. Fourth,
the NDRC’s Opinions on Accelerating the Use of
Natural Gas was introduced to drive fast and
coordinated development along the natural gas
value
chain—upstream,
midstream
and
downstream.
Table 9 Total energy consumption and energy consumption structure, 2000–15
Year
Total energy consumption
Energy consumption by type (%)
Total
Growth (%)
Coal
Oil
Natural gas
Non-fossil energy
2000
14.70
4.55
68.5
22.0
2.2
7.3
2001
15.55
5.84
68.0
21.2
2.4
8.4
2002
16.96
9.02
68.5
21.0
2.3
8.2
2003
19.71
16.22
70.2
20.1
2.3
7.4
2004
23.03
16.84
70.2
19.9
2.3
7.6
2005
26.14
13.50
72.4
17.8
2.4
7.4
2006
28.65
9.60
72.4
17.5
2.7
7.4
2007
31.14
8.72
72.5
17.0
3.0
7.5
2008
32.06
2.94
71.5
16.7
3.4
8.4
2009
33.61
4.84
71.6
16.4
3.5
8.5
2010
36.06
7.30
69.2
17.4
4.0
9.4
2011
38.70
7.32
70.2
16.8
4.6
8.4
2012
40.21
3.90
68.5
17.0
4.8
9.7
2013
41.69
3.67
67.4
17.1
5.3
10.2
2014
42.58
2.13
65.6
17.4
5.7
11.3
2015
43.00
0.99
63.7
18.3
5.9
12.1
2016
43.60
1.4
62.0
18.3
6.4
13.3
Source China Statistical Yearbook 2017
126
W. Xiaoming et al.
by developing and deploying carbon capture,
utilisation and storage technologies.
Currently, China is substituting oil and gas for
coal, and non-fossil fuels for fossil fuels. In 2016,
coal’s share of China’s total energy consumption
was 62%, down 6.5 percentage points from 2000;
whereas the share of natural gas and fossil fuels was
6.4% and 13.3% respectively, up 4.2 and 6 percentage points from 2000. In particular, the slowdown in energy consumption growth, which began
in 2013, provided an opportunity to optimise the
energy mix. The share of coal consumption in 2016
was 5.4 percentage points lower than in 2013, and
the share of fossil fuels and natural gas consumption in 2016 was 3.1 and 1.1 percentage points
higher respectively than in 2013 (Table 9).
3.1.5 Early Successes in Energy Supply
Reform
As China’s economic development entered the
new normal, its rapidly growing energy industry
—driven by the traditional modes of supply and
demand—began to show inadaptability and
regional and structural overcapacity. In response,
the national government implemented energy
supply-side reforms and reported its initial success in 2016. First, coal overcapacity was cut by
250 Mt annually. Second, the installed base of
power generation became cleaner: more than 200
GW of coal-fired generating units were upgraded
and made more energy efficient, more than 100
GW of coal-fired generation was upgraded to
ultra-low emission standards, and the installed
capacity of non-fossil energy rose to 36.1% of
the total. Third, substituting clean energy for
fossil fuels was vigorously encouraged. This
included the installation of electric heating in
homes and electric boilers in manufacturing
facilities, as well as clean heating demonstration
projects using renewable energy in provinces
such as Inner Mongolia, Hebei and Jilin. Fourth,
the NDRC’s Opinions on Accelerating the Use of
Natural Gas was introduced to drive fast and
coordinated development along the natural gas
value
chain—upstream,
midstream
and
downstream.
Table 9 Total energy consumption and energy consumption structure, 2000–15
Year
Total energy consumption
Energy consumption by type (%)
Total
Growth (%)
Coal
Oil
Natural gas
Non-fossil energy
2000
14.70
4.55
68.5
22.0
2.2
7.3
2001
15.55
5.84
68.0
21.2
2.4
8.4
2002
16.96
9.02
68.5
21.0
2.3
8.2
2003
19.71
16.22
70.2
20.1
2.3
7.4
2004
23.03
16.84
70.2
19.9
2.3
7.6
2005
26.14
13.50
72.4
17.8
2.4
7.4
2006
28.65
9.60
72.4
17.5
2.7
7.4
2007
31.14
8.72
72.5
17.0
3.0
7.5
2008
32.06
2.94
71.5
16.7
3.4
8.4
2009
33.61
4.84
71.6
16.4
3.5
8.5
2010
36.06
7.30
69.2
17.4
4.0
9.4
2011
38.70
7.32
70.2
16.8
4.6
8.4
2012
40.21
3.90
68.5
17.0
4.8
9.7
2013
41.69
3.67
67.4
17.1
5.3
10.2
2014
42.58
2.13
65.6
17.4
5.7
11.3
2015
43.00
0.99
63.7
18.3
5.9
12.1
2016
43.60
1.4
62.0
18.3
6.4
13.3
Source China Statistical Yearbook 2017
126
W. Xiaoming et al.