

19 On the Hydropower Energy Generation from Pipelines
217
1.7
2.2
2.7
3.2
3.7
4.2
4.7
5.2
5.7
6.2
12
16
20
24
Power Output (mW)
Number of blades
0.5 m
1.0 m
1.5 m
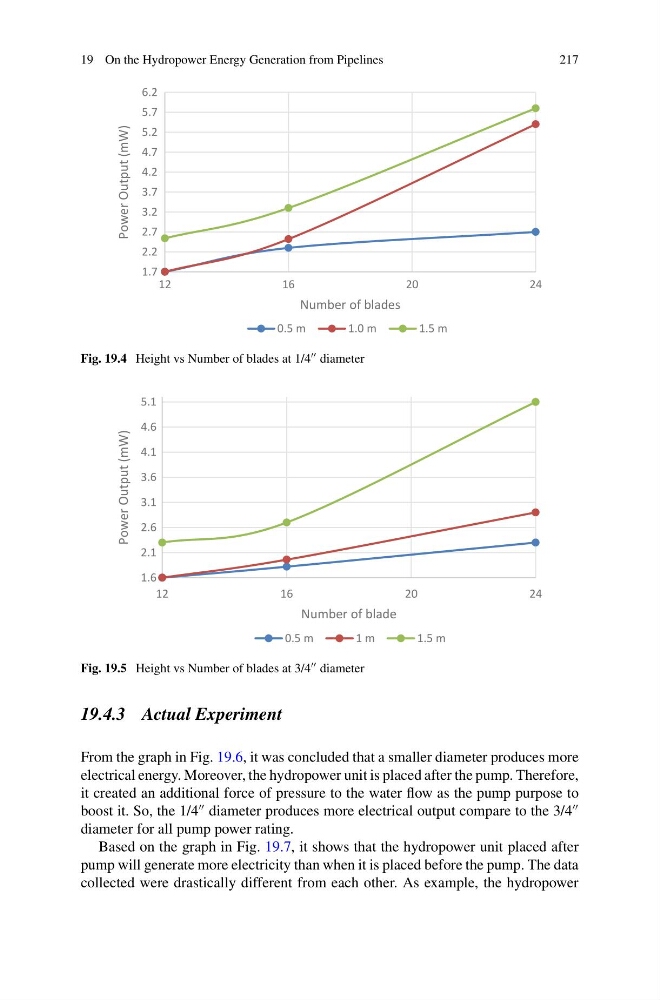
Fig. 19.4 Height vs Number of blades at 1/4 diameter
1.6
2.1
2.6
3.1
3.6
4.1
4.6
5.1
12
16
20
24
Power Output (mW)
Number of blade
0.5 m
1 m
1.5 m
Fig. 19.5 Height vs Number of blades at 3/4 diameter
19.4.3 Actual Experiment
From the graph in Fig. 19.6, it was concluded that a smaller diameter produces more
electrical energy. Moreover, the hydropower unit is placed after the pump. Therefore,
it created an additional force of pressure to the water flow as the pump purpose to
boost it. So, the 1/4
diameter produces more electrical output compare to the 3/4
diameter for all pump power rating.
Based on the graph in Fig. 19.7, it shows that the hydropower unit placed after
pump will generate more electricity than when it is placed before the pump. The data
collected were drastically different from each other. As example, the hydropower
217
1.7
2.2
2.7
3.2
3.7
4.2
4.7
5.2
5.7
6.2
12
16
20
24
Power Output (mW)
Number of blades
0.5 m
1.0 m
1.5 m
Fig. 19.4 Height vs Number of blades at 1/4 diameter
1.6
2.1
2.6
3.1
3.6
4.1
4.6
5.1
12
16
20
24
Power Output (mW)
Number of blade
0.5 m
1 m
1.5 m
Fig. 19.5 Height vs Number of blades at 3/4 diameter
19.4.3 Actual Experiment
From the graph in Fig. 19.6, it was concluded that a smaller diameter produces more
electrical energy. Moreover, the hydropower unit is placed after the pump. Therefore,
it created an additional force of pressure to the water flow as the pump purpose to
boost it. So, the 1/4
diameter produces more electrical output compare to the 3/4
diameter for all pump power rating.
Based on the graph in Fig. 19.7, it shows that the hydropower unit placed after
pump will generate more electricity than when it is placed before the pump. The data
collected were drastically different from each other. As example, the hydropower