

Objective Assessment of the Cooling Function of Textile Products …
9
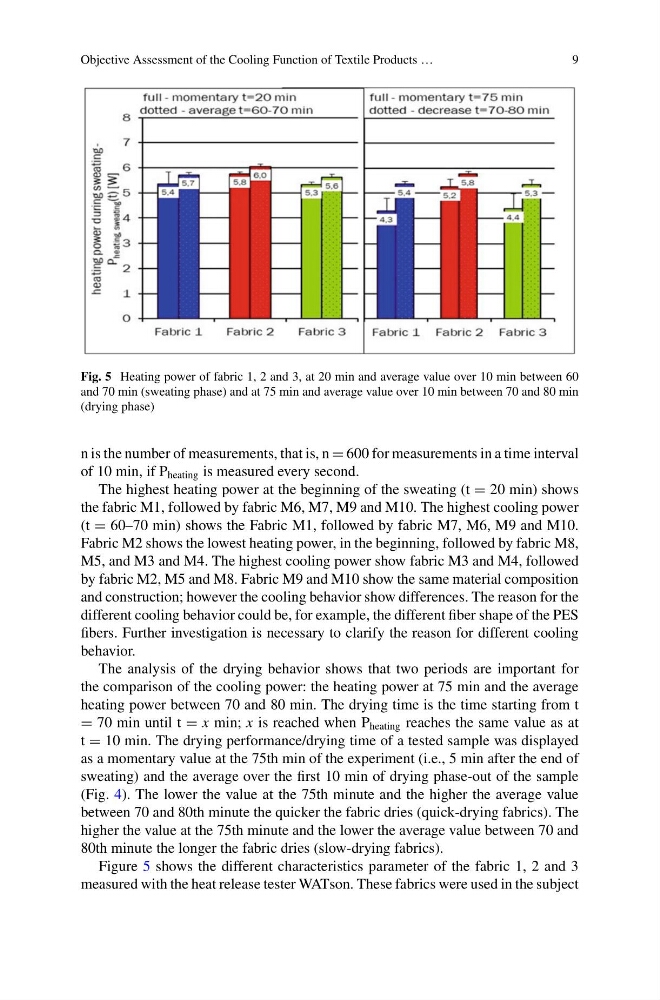
Fig. 5 Heating power of fabric 1, 2 and 3, at 20 min and average value over 10 min between 60
and 70 min (sweating phase) and at 75 min and average value over 10 min between 70 and 80 min
(drying phase)
n is the number of measurements, that is, n = 600 for measurements in a time interval
of 10 min, if P heating is measured every second.
The highest heating power at the beginning of the sweating (t = 20 min) shows
the fabric M1, followed by fabric M6, M7, M9 and M10. The highest cooling power
(t = 60–70 min) shows the Fabric M1, followed by fabric M7, M6, M9 and M10.
Fabric M2 shows the lowest heating power, in the beginning, followed by fabric M8,
M5, and M3 and M4. The highest cooling power show fabric M3 and M4, followed
by fabric M2, M5 and M8. Fabric M9 and M10 show the same material composition
and construction; however the cooling behavior show differences. The reason for the
different cooling behavior could be, for example, the different fiber shape of the PES
fibers. Further investigation is necessary to clarify the reason for different cooling
behavior.
The analysis of the drying behavior shows that two periods are important for
the comparison of the cooling power: the heating power at 75 min and the average
heating power between 70 and 80 min. The drying time is the time starting from t
= 70 min until t = x min; x is reached when P heating reaches the same value as at
t = 10 min. The drying performance/drying time of a tested sample was displayed
as a momentary value at the 75th min of the experiment (i.e., 5 min after the end of
sweating) and the average over the first 10 min of drying phase-out of the sample
(Fig. 4). The lower the value at the 75th minute and the higher the average value
between 70 and 80th minute the quicker the fabric dries (quick-drying fabrics). The
higher the value at the 75th minute and the lower the average value between 70 and
80th minute the longer the fabric dries (slow-drying fabrics).
Figure 5 shows the different characteristics parameter of the fabric 1, 2 and 3
measured with the heat release tester WATson. These fabrics were used in the subject
9
Fig. 5 Heating power of fabric 1, 2 and 3, at 20 min and average value over 10 min between 60
and 70 min (sweating phase) and at 75 min and average value over 10 min between 70 and 80 min
(drying phase)
n is the number of measurements, that is, n = 600 for measurements in a time interval
of 10 min, if P heating is measured every second.
The highest heating power at the beginning of the sweating (t = 20 min) shows
the fabric M1, followed by fabric M6, M7, M9 and M10. The highest cooling power
(t = 60–70 min) shows the Fabric M1, followed by fabric M7, M6, M9 and M10.
Fabric M2 shows the lowest heating power, in the beginning, followed by fabric M8,
M5, and M3 and M4. The highest cooling power show fabric M3 and M4, followed
by fabric M2, M5 and M8. Fabric M9 and M10 show the same material composition
and construction; however the cooling behavior show differences. The reason for the
different cooling behavior could be, for example, the different fiber shape of the PES
fibers. Further investigation is necessary to clarify the reason for different cooling
behavior.
The analysis of the drying behavior shows that two periods are important for
the comparison of the cooling power: the heating power at 75 min and the average
heating power between 70 and 80 min. The drying time is the time starting from t
= 70 min until t = x min; x is reached when P heating reaches the same value as at
t = 10 min. The drying performance/drying time of a tested sample was displayed
as a momentary value at the 75th min of the experiment (i.e., 5 min after the end of
sweating) and the average over the first 10 min of drying phase-out of the sample
(Fig. 4). The lower the value at the 75th minute and the higher the average value
between 70 and 80th minute the quicker the fabric dries (quick-drying fabrics). The
higher the value at the 75th minute and the lower the average value between 70 and
80th minute the longer the fabric dries (slow-drying fabrics).
Figure 5 shows the different characteristics parameter of the fabric 1, 2 and 3
measured with the heat release tester WATson. These fabrics were used in the subject