

Objective Assessment of the Cooling Function of Textile Products …
7
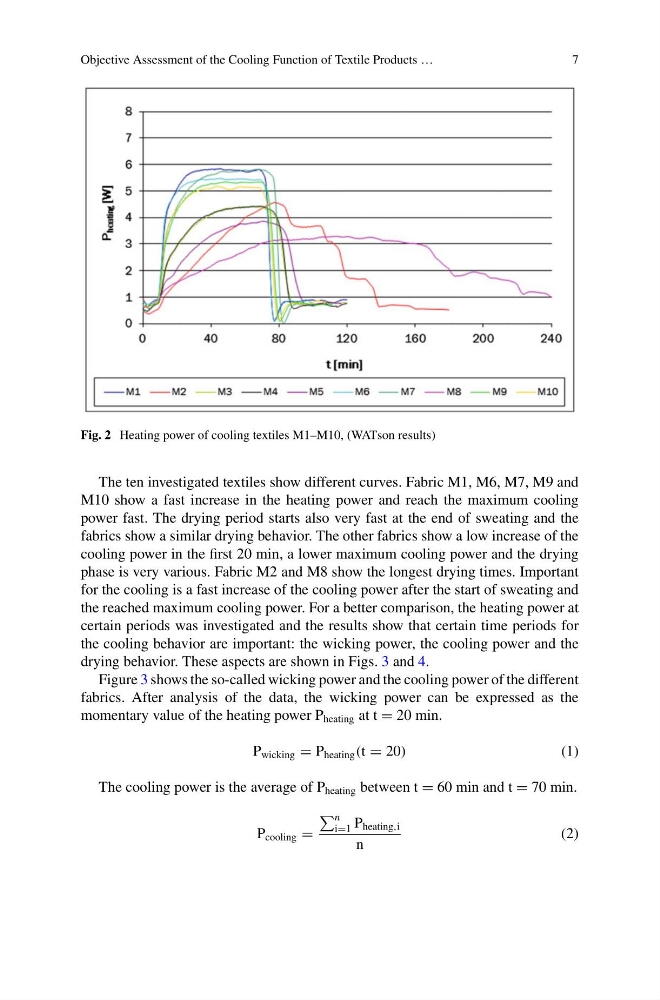
Fig. 2 Heating power of cooling textiles M1–M10, (WATson results)
The ten investigated textiles show different curves. Fabric M1, M6, M7, M9 and
M10 show a fast increase in the heating power and reach the maximum cooling
power fast. The drying period starts also very fast at the end of sweating and the
fabrics show a similar drying behavior. The other fabrics show a low increase of the
cooling power in the first 20 min, a lower maximum cooling power and the drying
phase is very various. Fabric M2 and M8 show the longest drying times. Important
for the cooling is a fast increase of the cooling power after the start of sweating and
the reached maximum cooling power. For a better comparison, the heating power at
certain periods was investigated and the results show that certain time periods for
the cooling behavior are important: the wicking power, the cooling power and the
drying behavior. These aspects are shown in Figs. 3 and 4.
Figure 3 shows the so-called wicking power and the cooling power of the different
fabrics. After analysis of the data, the wicking power can be expressed as the
momentary value of the heating power P heating at t = 20 min.
P wicking = P heating (t = 20)
(1)
The cooling power is the average of P heating between t = 60 min and t = 70 min.
P cooling =
n
i=1 P heating,i
n
(2)
7
Fig. 2 Heating power of cooling textiles M1–M10, (WATson results)
The ten investigated textiles show different curves. Fabric M1, M6, M7, M9 and
M10 show a fast increase in the heating power and reach the maximum cooling
power fast. The drying period starts also very fast at the end of sweating and the
fabrics show a similar drying behavior. The other fabrics show a low increase of the
cooling power in the first 20 min, a lower maximum cooling power and the drying
phase is very various. Fabric M2 and M8 show the longest drying times. Important
for the cooling is a fast increase of the cooling power after the start of sweating and
the reached maximum cooling power. For a better comparison, the heating power at
certain periods was investigated and the results show that certain time periods for
the cooling behavior are important: the wicking power, the cooling power and the
drying behavior. These aspects are shown in Figs. 3 and 4.
Figure 3 shows the so-called wicking power and the cooling power of the different
fabrics. After analysis of the data, the wicking power can be expressed as the
momentary value of the heating power P heating at t = 20 min.
P wicking = P heating (t = 20)
(1)
The cooling power is the average of P heating between t = 60 min and t = 70 min.
P cooling =
n
i=1 P heating,i
n
(2)