

Study of Vehicle Pulling Phenomenon and Various …
251
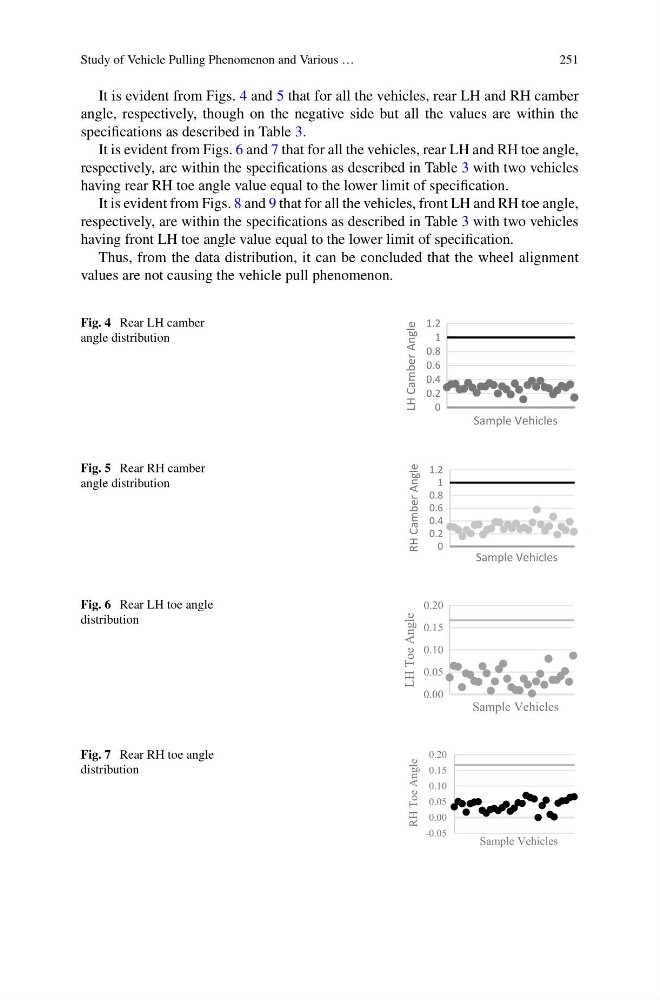
It is evident from Figs. 4 and 5 that for all the vehicles, rear LH and RH camber
angle, respectively, though on the negative side but all the values are within the
specifications as described in Table 3.
It is evident from Figs. 6 and 7 that for all the vehicles, rear LH and RH toe angle,
respectively, are within the specifications as described in Table 3 with two vehicles
having rear RH toe angle value equal to the lower limit of specification.
It is evident from Figs. 8 and 9 that for all the vehicles, front LH and RH toe angle,
respectively, are within the specifications as described in Table 3 with two vehicles
having front LH toe angle value equal to the lower limit of specification.
Thus, from the data distribution, it can be concluded that the wheel alignment
values are not causing the vehicle pull phenomenon.
Fig. 4 Rear LH camber
angle distribution
0
0.2
0.4
0.6
0.8
1
1.2
LH Camber Angle
Sample Vehicles
Fig. 5 Rear RH camber
angle distribution
0
0.2
0.4
0.6
0.8
1
1.2
RH Camber Angle
Sample Vehicles
Fig. 6 Rear LH toe angle
distribution
0.00
0.05
0.10
0.15
0.20
LH Toe Angle
Sample Vehicles
Fig. 7 Rear RH toe angle
distribution
-0.05
0.00
0.05
0.10
0.15
0.20
RH Toe Angle
Sample Vehicles
251
It is evident from Figs. 4 and 5 that for all the vehicles, rear LH and RH camber
angle, respectively, though on the negative side but all the values are within the
specifications as described in Table 3.
It is evident from Figs. 6 and 7 that for all the vehicles, rear LH and RH toe angle,
respectively, are within the specifications as described in Table 3 with two vehicles
having rear RH toe angle value equal to the lower limit of specification.
It is evident from Figs. 8 and 9 that for all the vehicles, front LH and RH toe angle,
respectively, are within the specifications as described in Table 3 with two vehicles
having front LH toe angle value equal to the lower limit of specification.
Thus, from the data distribution, it can be concluded that the wheel alignment
values are not causing the vehicle pull phenomenon.
Fig. 4 Rear LH camber
angle distribution
0
0.2
0.4
0.6
0.8
1
1.2
LH Camber Angle
Sample Vehicles
Fig. 5 Rear RH camber
angle distribution
0
0.2
0.4
0.6
0.8
1
1.2
RH Camber Angle
Sample Vehicles
Fig. 6 Rear LH toe angle
distribution
0.00
0.05
0.10
0.15
0.20
LH Toe Angle
Sample Vehicles
Fig. 7 Rear RH toe angle
distribution
-0.05
0.00
0.05
0.10
0.15
0.20
RH Toe Angle
Sample Vehicles