

228
C. Rajkumar et al.
Table 6 ANOVA table
Source
DF
SS
MS
F
P
Contribution %
Load
1
9.193
9.1935
0.73
0.432
3.0
Material
1
54.677
54.6771
4.34
0.092
18.0
Condition
1
53.588
53.5877
4.25
0.094
17.6
Atmosphere
1
13.561
13.5608
1.08
0.347
4.5
Load * Material
1
9.35
9.3497
0.74
0.429
3.1
Load * Condition
1
0.366
0.3663
0.03
0.871
0.1
Load * Atmosphere
1
30.865
30.8648
2.45
0.179
10.2
Material * Condition
1
15.027
15.0271
1.19
0.325
4.9
Material * Atmosphere
1
12.628
12.6278
1
0.363
4.2
Condition * Atmosphere
1
41.682
41.6822
3.3
0.129
13.7
Residual error
5
63.062
12.6123
20.7
Total
15
303.999
100.0
30
20
30.5
30.0
29.5
29.0
28.5
28.0
27.5
27.0
26.5
DSS-B
DSS-A
Forged
Sintered
Partial-Vacuum
Hydrogen
Load
Mean of SN ratios
Material
Condition
Atmosphere
Main Effects Plot for SN ratios
Data Means
Signal-to-noise: Smaller is better
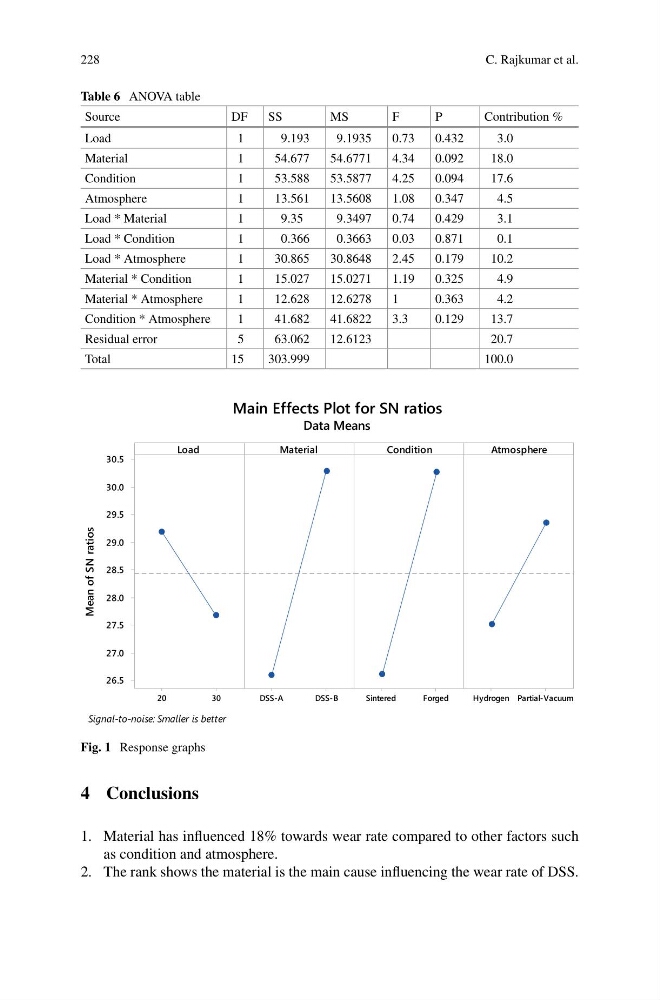
Fig. 1 Response graphs
4 Conclusions
1. Material has influenced 18% towards wear rate compared to other factors such
as condition and atmosphere.
2. The rank shows the material is the main cause influencing the wear rate of DSS.
C. Rajkumar et al.
Table 6 ANOVA table
Source
DF
SS
MS
F
P
Contribution %
Load
1
9.193
9.1935
0.73
0.432
3.0
Material
1
54.677
54.6771
4.34
0.092
18.0
Condition
1
53.588
53.5877
4.25
0.094
17.6
Atmosphere
1
13.561
13.5608
1.08
0.347
4.5
Load * Material
1
9.35
9.3497
0.74
0.429
3.1
Load * Condition
1
0.366
0.3663
0.03
0.871
0.1
Load * Atmosphere
1
30.865
30.8648
2.45
0.179
10.2
Material * Condition
1
15.027
15.0271
1.19
0.325
4.9
Material * Atmosphere
1
12.628
12.6278
1
0.363
4.2
Condition * Atmosphere
1
41.682
41.6822
3.3
0.129
13.7
Residual error
5
63.062
12.6123
20.7
Total
15
303.999
100.0
30
20
30.5
30.0
29.5
29.0
28.5
28.0
27.5
27.0
26.5
DSS-B
DSS-A
Forged
Sintered
Partial-Vacuum
Hydrogen
Load
Mean of SN ratios
Material
Condition
Atmosphere
Main Effects Plot for SN ratios
Data Means
Signal-to-noise: Smaller is better
Fig. 1 Response graphs
4 Conclusions
1. Material has influenced 18% towards wear rate compared to other factors such
as condition and atmosphere.
2. The rank shows the material is the main cause influencing the wear rate of DSS.