

Study who were aged 65–90 years and had no dementia during the period from 2002
through 2014. The average number of follow-up assessments among the 1724 adults
was 3.9, and the total number of observations was 6755. There were 205 (11.9%)
cases of incident disabling dementia among the 1724 participants during the period
through 2014. In this study, disabling dementia was defined as LTCI system level II
or worse dementia, as this is the level at which applicants are entitled to receive
insurance benefits, including institutional, home, respite, and/or day care and loans
of equipment. The date of participant application for disabling dementia classification was ascertained by consulting the LTCI system. At baseline, the average
(SD) age of study participants without dementia was 71.3 (5.7) years; 56.7% were
woman, 43.5% had no chronic diseases and the average number of years of education was 9.9 (2.7).
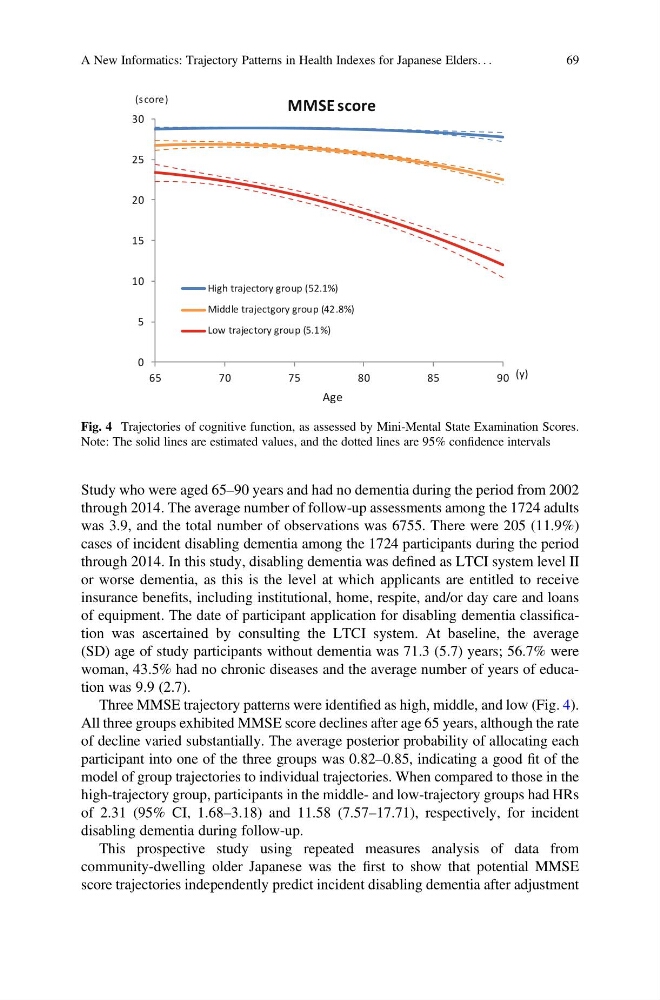
Three MMSE trajectory patterns were identified as high, middle, and low (Fig. 4).
All three groups exhibited MMSE score declines after age 65 years, although the rate
of decline varied substantially. The average posterior probability of allocating each
participant into one of the three groups was 0.82–0.85, indicating a good fit of the
model of group trajectories to individual trajectories. When compared to those in the
high-trajectory group, participants in the middle- and low-trajectory groups had HRs
of 2.31 (95% CI, 1.68–3.18) and 11.58 (7.57–17.71), respectively, for incident
disabling dementia during follow-up.
This prospective study using repeated measures analysis of data from
community-dwelling older Japanese was the first to show that potential MMSE
score trajectories independently predict incident disabling dementia after adjustment
0
5
10
15
20
25
30
65
70
75
80
85
90
High trajectory group (52.1%)
Middle trajectgory group (42.8%)
Low trajectory group (5.1%)
(y)
(s core)
Age
MMSE score
Fig. 4 Trajectories of cognitive function, as assessed by Mini-Mental State Examination Scores.
Note: The solid lines are estimated values, and the dotted lines are 95% confidence intervals
A New Informatics: Trajectory Patterns in Health Indexes for Japanese Elders. . .
69
through 2014. The average number of follow-up assessments among the 1724 adults
was 3.9, and the total number of observations was 6755. There were 205 (11.9%)
cases of incident disabling dementia among the 1724 participants during the period
through 2014. In this study, disabling dementia was defined as LTCI system level II
or worse dementia, as this is the level at which applicants are entitled to receive
insurance benefits, including institutional, home, respite, and/or day care and loans
of equipment. The date of participant application for disabling dementia classification was ascertained by consulting the LTCI system. At baseline, the average
(SD) age of study participants without dementia was 71.3 (5.7) years; 56.7% were
woman, 43.5% had no chronic diseases and the average number of years of education was 9.9 (2.7).
Three MMSE trajectory patterns were identified as high, middle, and low (Fig. 4).
All three groups exhibited MMSE score declines after age 65 years, although the rate
of decline varied substantially. The average posterior probability of allocating each
participant into one of the three groups was 0.82–0.85, indicating a good fit of the
model of group trajectories to individual trajectories. When compared to those in the
high-trajectory group, participants in the middle- and low-trajectory groups had HRs
of 2.31 (95% CI, 1.68–3.18) and 11.58 (7.57–17.71), respectively, for incident
disabling dementia during follow-up.
This prospective study using repeated measures analysis of data from
community-dwelling older Japanese was the first to show that potential MMSE
score trajectories independently predict incident disabling dementia after adjustment
0
5
10
15
20
25
30
65
70
75
80
85
90
High trajectory group (52.1%)
Middle trajectgory group (42.8%)
Low trajectory group (5.1%)
(y)
(s core)
Age
MMSE score
Fig. 4 Trajectories of cognitive function, as assessed by Mini-Mental State Examination Scores.
Note: The solid lines are estimated values, and the dotted lines are 95% confidence intervals
A New Informatics: Trajectory Patterns in Health Indexes for Japanese Elders. . .
69