

2
1 Wastes Generation, Characterization, Management Strategies …
The growth of population, industrialization, improved standards of living and most
importantly consumerism have resulted in an increase in waste generation, which
subsequently raised the concerns on environmental degradation [1]. The greatest
increase in waste generation began during the industrial revolution in the nineteenth
century and continues today [2]. For instance, the global waste generation increased
from 365 Mt in 1965 to 1999 Mt in 2015 [3].
Taking Municipal Solid Wastes (MSW) as an example, current global MSW generation levels climb to over 2 billion tonnes per year [4], and the world-average per
capita waste generation rate is approx. 1.2 kg per person per day, or 438 kg per capita
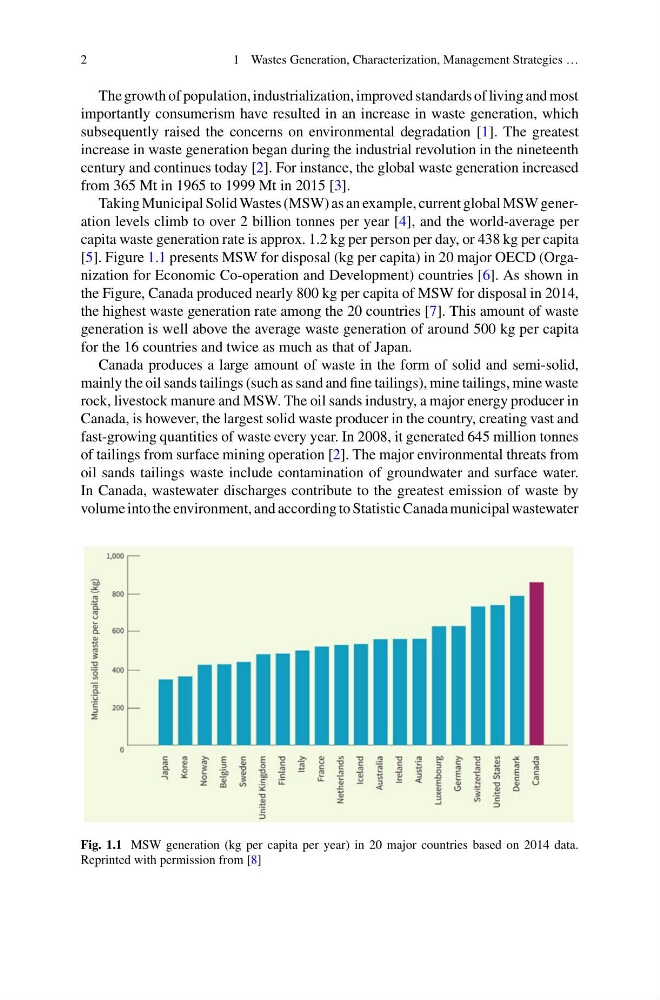
[5]. Figure 1.1 presents MSW for disposal (kg per capita) in 20 major OECD (Organization for Economic Co-operation and Development) countries [6]. As shown in
the Figure, Canada produced nearly 800 kg per capita of MSW for disposal in 2014,
the highest waste generation rate among the 20 countries [7]. This amount of waste
generation is well above the average waste generation of around 500 kg per capita
for the 16 countries and twice as much as that of Japan.
Canada produces a large amount of waste in the form of solid and semi-solid,
mainly the oil sands tailings (such as sand and fine tailings), mine tailings, mine waste
rock, livestock manure and MSW. The oil sands industry, a major energy producer in
Canada, is however, the largest solid waste producer in the country, creating vast and
fast-growing quantities of waste every year. In 2008, it generated 645 million tonnes
of tailings from surface mining operation [2]. The major environmental threats from
oil sands tailings waste include contamination of groundwater and surface water.
In Canada, wastewater discharges contribute to the greatest emission of waste by
volume into the environment, and according to Statistic Canada municipal wastewater
Fig. 1.1 MSW generation (kg per capita per year) in 20 major countries based on 2014 data.
Reprinted with permission from [8]
1 Wastes Generation, Characterization, Management Strategies …
The growth of population, industrialization, improved standards of living and most
importantly consumerism have resulted in an increase in waste generation, which
subsequently raised the concerns on environmental degradation [1]. The greatest
increase in waste generation began during the industrial revolution in the nineteenth
century and continues today [2]. For instance, the global waste generation increased
from 365 Mt in 1965 to 1999 Mt in 2015 [3].
Taking Municipal Solid Wastes (MSW) as an example, current global MSW generation levels climb to over 2 billion tonnes per year [4], and the world-average per
capita waste generation rate is approx. 1.2 kg per person per day, or 438 kg per capita
[5]. Figure 1.1 presents MSW for disposal (kg per capita) in 20 major OECD (Organization for Economic Co-operation and Development) countries [6]. As shown in
the Figure, Canada produced nearly 800 kg per capita of MSW for disposal in 2014,
the highest waste generation rate among the 20 countries [7]. This amount of waste
generation is well above the average waste generation of around 500 kg per capita
for the 16 countries and twice as much as that of Japan.
Canada produces a large amount of waste in the form of solid and semi-solid,
mainly the oil sands tailings (such as sand and fine tailings), mine tailings, mine waste
rock, livestock manure and MSW. The oil sands industry, a major energy producer in
Canada, is however, the largest solid waste producer in the country, creating vast and
fast-growing quantities of waste every year. In 2008, it generated 645 million tonnes
of tailings from surface mining operation [2]. The major environmental threats from
oil sands tailings waste include contamination of groundwater and surface water.
In Canada, wastewater discharges contribute to the greatest emission of waste by
volume into the environment, and according to Statistic Canada municipal wastewater
Fig. 1.1 MSW generation (kg per capita per year) in 20 major countries based on 2014 data.
Reprinted with permission from [8]