

1.4 The Coexistence of Phases and the Critical Point
27
1.4
The Coexistence of Phases and the
Critical Point
Transitions from a gaseous state to a liquid state or from a liquid state to a solid state,
and so forth, are called phase transitions and the samples of matter in the different
states are called phases. Such transitions can take place abruptly. If a gas is initially
at a temperature slightly above its condensation temperature, a small decrease in the
temperature can produce a liquid phase that coexists with the gas phases, and a further
small decrease in the temperature can cause the system to become a single liquid phase.
This remarkable behavior is an exception to the general rule that in nature small changes
produce small effects and large changes produce large effects.
It is an experimental fact that for any pure substance the pressure at which two phases
can coexist at equilibrium is a smooth function of the temperature. Equivalently, the
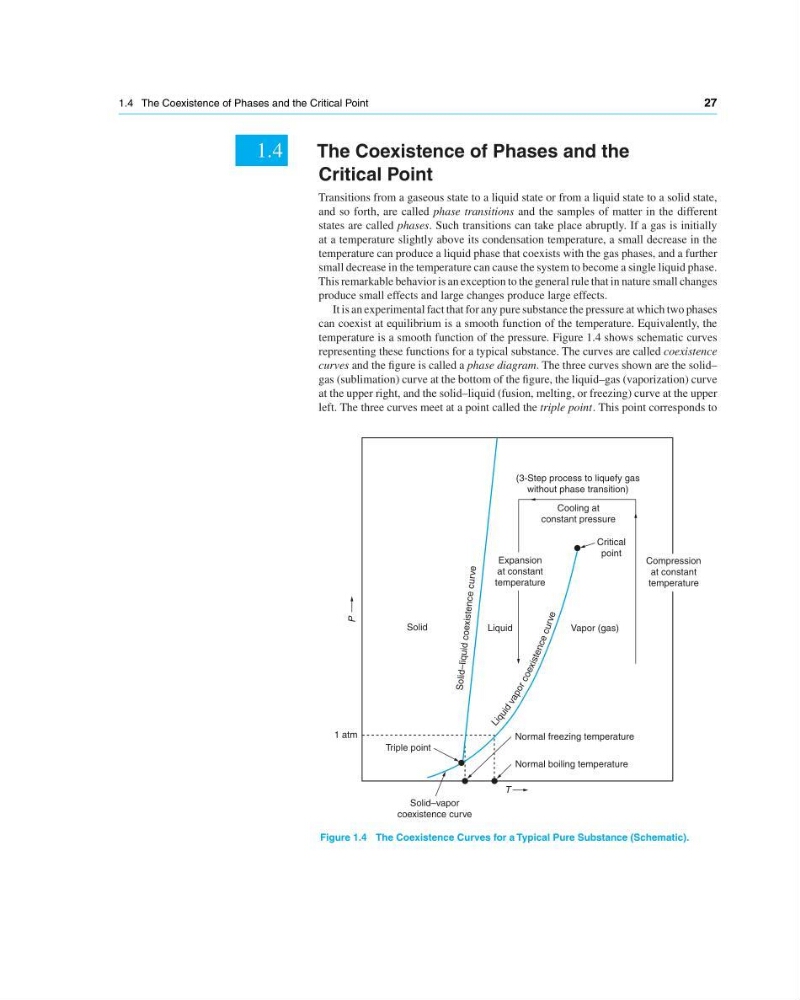
temperature is a smooth function of the pressure. Figure 1.4 shows schematic curves
representing these functions for a typical substance. The curves are called coexistence
curves and the figure is called a phase diagram. The three curves shown are the solid–
gas (sublimation) curve at the bottom of the figure, the liquid–gas (vaporization) curve
at the upper right, and the solid–liquid (fusion, melting, or freezing) curve at the upper
left. The three curves meet at a point called the triple point. This point corresponds to
L i q u i d v a p o r c o e x is te n c e c u rv e
Triple point
Solid–vapor
coexistence curve
T
Normal freezing temperature
Normal boiling temperature
Solid
(3-Step process to liquefy gas
without phase transition)
Cooling at
constant pressure
Critical
point
Expansion
at constant
temperature
Compression
at constant
temperature
Vapor (gas)
Liquid
1 atm
P
So lid– liqu id coe xis ten ce cur ve
Figure 1.4 The Coexistence Curves for a Typical Pure Substance (Schematic).
27
1.4
The Coexistence of Phases and the
Critical Point
Transitions from a gaseous state to a liquid state or from a liquid state to a solid state,
and so forth, are called phase transitions and the samples of matter in the different
states are called phases. Such transitions can take place abruptly. If a gas is initially
at a temperature slightly above its condensation temperature, a small decrease in the
temperature can produce a liquid phase that coexists with the gas phases, and a further
small decrease in the temperature can cause the system to become a single liquid phase.
This remarkable behavior is an exception to the general rule that in nature small changes
produce small effects and large changes produce large effects.
It is an experimental fact that for any pure substance the pressure at which two phases
can coexist at equilibrium is a smooth function of the temperature. Equivalently, the
temperature is a smooth function of the pressure. Figure 1.4 shows schematic curves
representing these functions for a typical substance. The curves are called coexistence
curves and the figure is called a phase diagram. The three curves shown are the solid–
gas (sublimation) curve at the bottom of the figure, the liquid–gas (vaporization) curve
at the upper right, and the solid–liquid (fusion, melting, or freezing) curve at the upper
left. The three curves meet at a point called the triple point. This point corresponds to
L i q u i d v a p o r c o e x is te n c e c u rv e
Triple point
Solid–vapor
coexistence curve
T
Normal freezing temperature
Normal boiling temperature
Solid
(3-Step process to liquefy gas
without phase transition)
Cooling at
constant pressure
Critical
point
Expansion
at constant
temperature
Compression
at constant
temperature
Vapor (gas)
Liquid
1 atm
P
So lid– liqu id coe xis ten ce cur ve
Figure 1.4 The Coexistence Curves for a Typical Pure Substance (Schematic).