

24
1 The Behavior of Gases and Liquids
Graphical Representation of Volumetric Data for Gases
The compression factor, denoted by Z, is sometimes used to describe the behavior of
real gases:
Z
PV m
RT
(1.3-5)
Some authors call Z the compressibility factor. We avoid this name because it might
be confused with the compressibility. The compression factor equals unity for an ideal
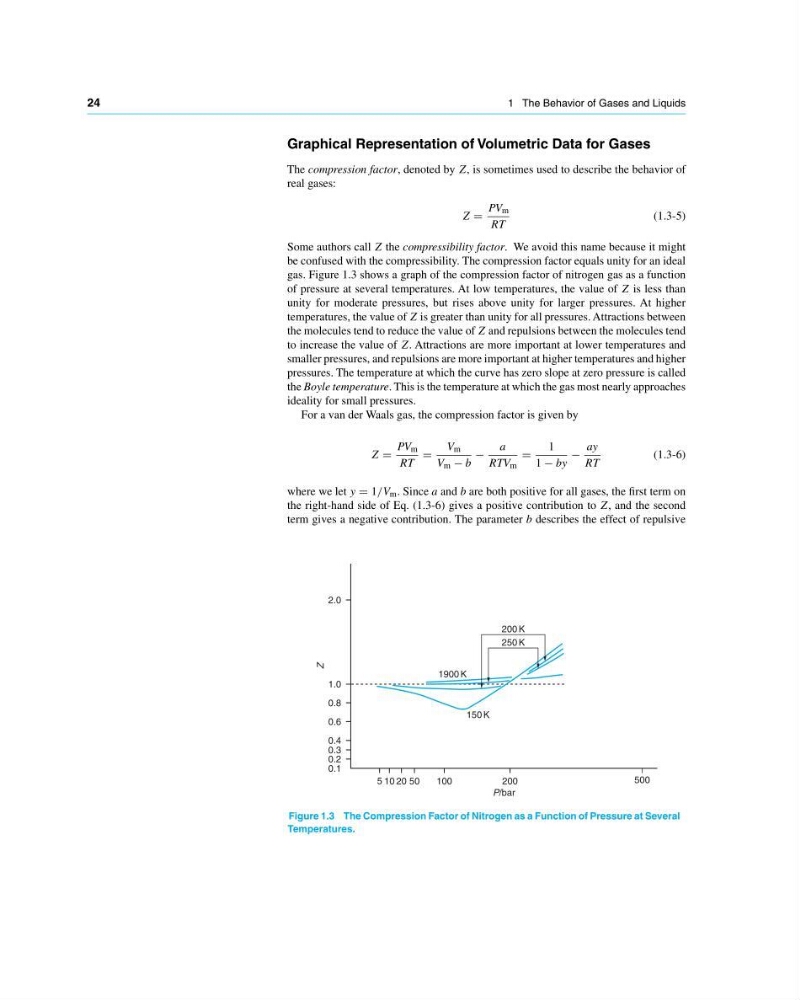
gas. Figure 1.3 shows a graph of the compression factor of nitrogen gas as a function
of pressure at several temperatures. At low temperatures, the value of Z is less than
unity for moderate pressures, but rises above unity for larger pressures. At higher
temperatures, the value of Z is greater than unity for all pressures. Attractions between
the molecules tend to reduce the value of Z and repulsions between the molecules tend
to increase the value of Z. Attractions are more important at lower temperatures and
smaller pressures, and repulsions are more important at higher temperatures and higher
pressures. The temperature at which the curve has zero slope at zero pressure is called
the Boyle temperature. This is the temperature at which the gas most nearly approaches
ideality for small pressures.
For a van der Waals gas, the compression factor is given by
Z
PV m
RT
V m
V m − b
−
a
RTV m
1
1 − by
−
ay
RT
(1.3-6)
where we let y 1/V m . Since a and b are both positive for all gases, the first term on
the right-hand side of Eq. (1.3-6) gives a positive contribution to Z, and the second
term gives a negative contribution. The parameter b describes the effect of repulsive
5
0.1
0.2
0.3
0.4
0.6
0.8
1.0
2.0
10 20 50
100
200
P/bar
500
1900 K
150 K
200 K
250 K
Z
Figure 1.3 The Compression Factor of Nitrogen as a Function of Pressure at Several
Temperatures.
1 The Behavior of Gases and Liquids
Graphical Representation of Volumetric Data for Gases
The compression factor, denoted by Z, is sometimes used to describe the behavior of
real gases:
Z
PV m
RT
(1.3-5)
Some authors call Z the compressibility factor. We avoid this name because it might
be confused with the compressibility. The compression factor equals unity for an ideal
gas. Figure 1.3 shows a graph of the compression factor of nitrogen gas as a function
of pressure at several temperatures. At low temperatures, the value of Z is less than
unity for moderate pressures, but rises above unity for larger pressures. At higher
temperatures, the value of Z is greater than unity for all pressures. Attractions between
the molecules tend to reduce the value of Z and repulsions between the molecules tend
to increase the value of Z. Attractions are more important at lower temperatures and
smaller pressures, and repulsions are more important at higher temperatures and higher
pressures. The temperature at which the curve has zero slope at zero pressure is called
the Boyle temperature. This is the temperature at which the gas most nearly approaches
ideality for small pressures.
For a van der Waals gas, the compression factor is given by
Z
PV m
RT
V m
V m − b
−
a
RTV m
1
1 − by
−
ay
RT
(1.3-6)
where we let y 1/V m . Since a and b are both positive for all gases, the first term on
the right-hand side of Eq. (1.3-6) gives a positive contribution to Z, and the second
term gives a negative contribution. The parameter b describes the effect of repulsive
5
0.1
0.2
0.3
0.4
0.6
0.8
1.0
2.0
10 20 50
100
200
P/bar
500
1900 K
150 K
200 K
250 K
Z
Figure 1.3 The Compression Factor of Nitrogen as a Function of Pressure at Several
Temperatures.