

284
6 The Thermodynamics of Solutions
160
150
Area of vapor states
Tie line area –
one liquid phase,
one vapor phase
Area of states
of one liquid
Tie line area –
one liquid phase,
one vapor phase
Tie line area –
two liquid phases
x f 5 0.478
x f 5 0.0406
x f 5 0.0917
x f 5 Furfural mole fraction
140
130
120
110
100
90
0.2
1.0
0.4
0.6
0.8
0
t
C /8C
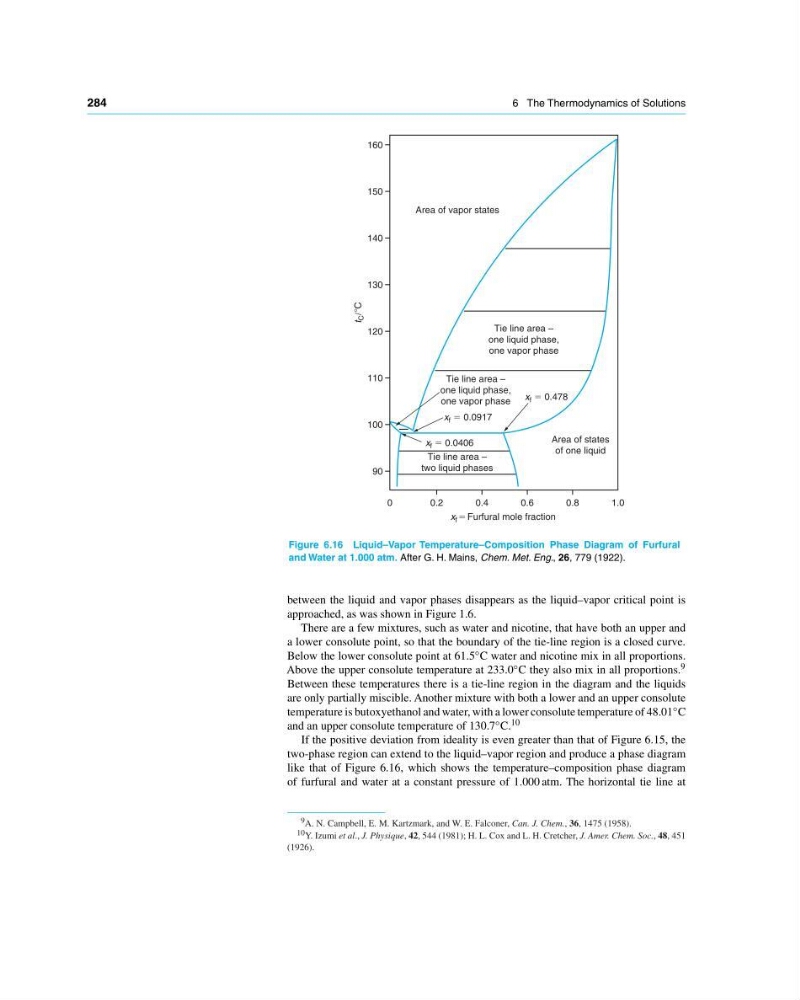
Figure 6.16 Liquid–Vapor Temperature–Composition Phase Diagram of Furfural
and Water at 1.000 atm. After G. H. Mains, Chem. Met. Eng., 26, 779 (1922).
between the liquid and vapor phases disappears as the liquid–vapor critical point is
approached, as was shown in Figure 1.6.
There are a few mixtures, such as water and nicotine, that have both an upper and
a lower consolute point, so that the boundary of the tie-line region is a closed curve.
Below the lower consolute point at 61.5 ◦ C water and nicotine mix in all proportions.
Above the upper consolute temperature at 233.0 ◦ C they also mix in all proportions. 9
Between these temperatures there is a tie-line region in the diagram and the liquids
are only partially miscible. Another mixture with both a lower and an upper consolute
temperature is butoxyethanol and water, with a lower consolute temperature of 48.01 ◦ C
and an upper consolute temperature of 130.7 ◦ C. 10
If the positive deviation from ideality is even greater than that of Figure 6.15, the
two-phase region can extend to the liquid–vapor region and produce a phase diagram
like that of Figure 6.16, which shows the temperature–composition phase diagram
of furfural and water at a constant pressure of 1.000 atm. The horizontal tie line at
9 A. N. Campbell, E. M. Kartzmark, and W. E. Falconer, Can. J. Chem., 36, 1475 (1958).
10 Y. Izumi et al., J. Physique, 42, 544 (1981); H. L. Cox and L. H. Cretcher, J. Amer. Chem. Soc., 48, 451
(1926).
6 The Thermodynamics of Solutions
160
150
Area of vapor states
Tie line area –
one liquid phase,
one vapor phase
Area of states
of one liquid
Tie line area –
one liquid phase,
one vapor phase
Tie line area –
two liquid phases
x f 5 0.478
x f 5 0.0406
x f 5 0.0917
x f 5 Furfural mole fraction
140
130
120
110
100
90
0.2
1.0
0.4
0.6
0.8
0
t
C /8C
Figure 6.16 Liquid–Vapor Temperature–Composition Phase Diagram of Furfural
and Water at 1.000 atm. After G. H. Mains, Chem. Met. Eng., 26, 779 (1922).
between the liquid and vapor phases disappears as the liquid–vapor critical point is
approached, as was shown in Figure 1.6.
There are a few mixtures, such as water and nicotine, that have both an upper and
a lower consolute point, so that the boundary of the tie-line region is a closed curve.
Below the lower consolute point at 61.5 ◦ C water and nicotine mix in all proportions.
Above the upper consolute temperature at 233.0 ◦ C they also mix in all proportions. 9
Between these temperatures there is a tie-line region in the diagram and the liquids
are only partially miscible. Another mixture with both a lower and an upper consolute
temperature is butoxyethanol and water, with a lower consolute temperature of 48.01 ◦ C
and an upper consolute temperature of 130.7 ◦ C. 10
If the positive deviation from ideality is even greater than that of Figure 6.15, the
two-phase region can extend to the liquid–vapor region and produce a phase diagram
like that of Figure 6.16, which shows the temperature–composition phase diagram
of furfural and water at a constant pressure of 1.000 atm. The horizontal tie line at
9 A. N. Campbell, E. M. Kartzmark, and W. E. Falconer, Can. J. Chem., 36, 1475 (1958).
10 Y. Izumi et al., J. Physique, 42, 544 (1981); H. L. Cox and L. H. Cretcher, J. Amer. Chem. Soc., 48, 451
(1926).