

5.4 The Gibbs Energy and Phase Transitions
219
E X A M P L E 5.8
Estimate the critical temperature of water by finding the temperature at which ∆ vap H m
vanishes. Assume that ∆C P,m is temperature-independent so that
∆ vap H m (T ) ∆ vap H m (T 1 ) + ∆C P,m (T − T 1 )
Let T 1 373.15 K and use the value of ∆C P,m that applies at 500 K. Compare your answer
with the correct value, 647.2 K, and explain any significant difference.
Solution
∆ vap H m (T 1 ) + ∆C P,m (T − T 1 ) 40669 J mol −1 + (−41.761 J K −1 mol −1 )
× (T − 373.15 K)
We set this expression equal to zero: and divide by 1 J mol −1
0 40699 − (41.761 K −1 )T + 15583
T
56252
41.761 K −1 1347 K
The agreement is poor, probably because the assumption that ∆C P,m is constant is poor.
Exercise 5.12
Estimate the critical temperature of water by finding the temperature at which ∆ vap S m vanishes.
Assume that ∆C P,m is temperature-independent.
The Maxwell Equal-Area Construction
As shown in Figures 1.7 and 1.8, a single surface represents the pressure of both the
liquid and the gas as a function of T and V m . A completely successful equation of state
would represent both phases, including the area of tie lines below the critical point.
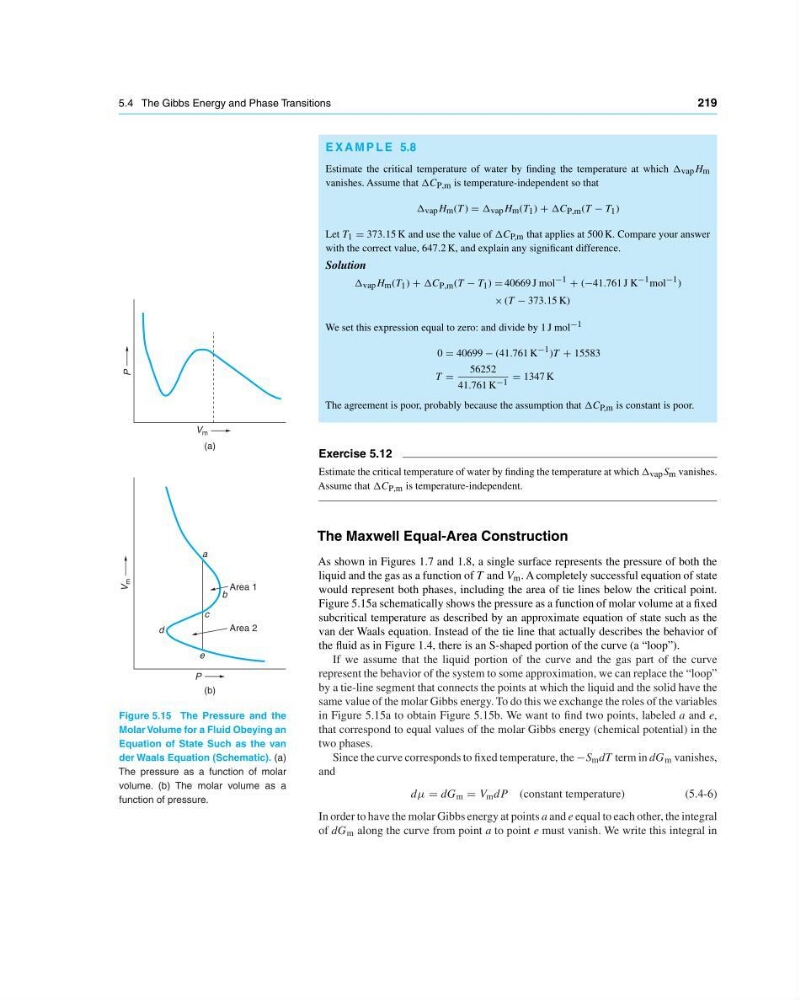
Figure 5.15a schematically shows the pressure as a function of molar volume at a fixed
subcritical temperature as described by an approximate equation of state such as the
van der Waals equation. Instead of the tie line that actually describes the behavior of
the fluid as in Figure 1.4, there is an S-shaped portion of the curve (a “loop”).
P
V m
P
V
m
Area 1
Area 2
a
b
c
d
e
(a)
(b)
Figure 5.15 The Pressure and the
Molar Volume for a Fluid Obeying an
Equation of State Such as the van
der Waals Equation (Schematic). (a)
The pressure as a function of molar
volume. (b) The molar volume as a
function of pressure.
If we assume that the liquid portion of the curve and the gas part of the curve
represent the behavior of the system to some approximation, we can replace the “loop”
by a tie-line segment that connects the points at which the liquid and the solid have the
same value of the molar Gibbs energy. To do this we exchange the roles of the variables
in Figure 5.15a to obtain Figure 5.15b. We want to find two points, labeled a and e,
that correspond to equal values of the molar Gibbs energy (chemical potential) in the
two phases.
Since the curve corresponds to fixed temperature, the −S m dT term in dG m vanishes,
and
dµ dG m V m dP (constant temperature)
(5.4-6)
In order to have the molar Gibbs energy at points a and e equal to each other, the integral
of dG m along the curve from point a to point e must vanish. We write this integral in
219
E X A M P L E 5.8
Estimate the critical temperature of water by finding the temperature at which ∆ vap H m
vanishes. Assume that ∆C P,m is temperature-independent so that
∆ vap H m (T ) ∆ vap H m (T 1 ) + ∆C P,m (T − T 1 )
Let T 1 373.15 K and use the value of ∆C P,m that applies at 500 K. Compare your answer
with the correct value, 647.2 K, and explain any significant difference.
Solution
∆ vap H m (T 1 ) + ∆C P,m (T − T 1 ) 40669 J mol −1 + (−41.761 J K −1 mol −1 )
× (T − 373.15 K)
We set this expression equal to zero: and divide by 1 J mol −1
0 40699 − (41.761 K −1 )T + 15583
T
56252
41.761 K −1 1347 K
The agreement is poor, probably because the assumption that ∆C P,m is constant is poor.
Exercise 5.12
Estimate the critical temperature of water by finding the temperature at which ∆ vap S m vanishes.
Assume that ∆C P,m is temperature-independent.
The Maxwell Equal-Area Construction
As shown in Figures 1.7 and 1.8, a single surface represents the pressure of both the
liquid and the gas as a function of T and V m . A completely successful equation of state
would represent both phases, including the area of tie lines below the critical point.
Figure 5.15a schematically shows the pressure as a function of molar volume at a fixed
subcritical temperature as described by an approximate equation of state such as the
van der Waals equation. Instead of the tie line that actually describes the behavior of
the fluid as in Figure 1.4, there is an S-shaped portion of the curve (a “loop”).
P
V m
P
V
m
Area 1
Area 2
a
b
c
d
e
(a)
(b)
Figure 5.15 The Pressure and the
Molar Volume for a Fluid Obeying an
Equation of State Such as the van
der Waals Equation (Schematic). (a)
The pressure as a function of molar
volume. (b) The molar volume as a
function of pressure.
If we assume that the liquid portion of the curve and the gas part of the curve
represent the behavior of the system to some approximation, we can replace the “loop”
by a tie-line segment that connects the points at which the liquid and the solid have the
same value of the molar Gibbs energy. To do this we exchange the roles of the variables
in Figure 5.15a to obtain Figure 5.15b. We want to find two points, labeled a and e,
that correspond to equal values of the molar Gibbs energy (chemical potential) in the
two phases.
Since the curve corresponds to fixed temperature, the −S m dT term in dG m vanishes,
and
dµ dG m V m dP (constant temperature)
(5.4-6)
In order to have the molar Gibbs energy at points a and e equal to each other, the integral
of dG m along the curve from point a to point e must vanish. We write this integral in