

278
D. Escudero
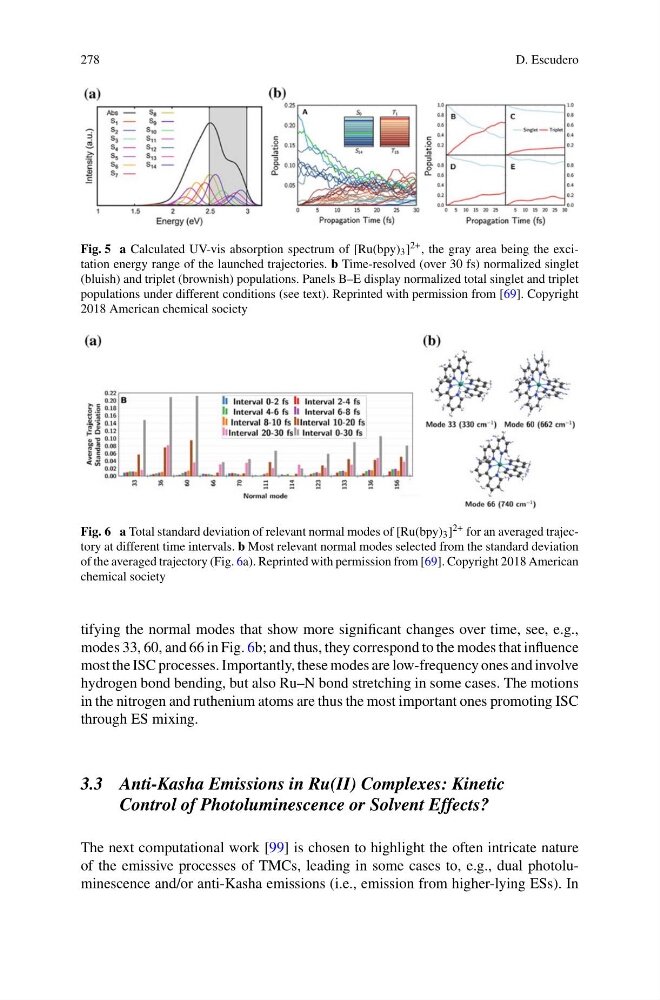
Fig. 5 a Calculated UV-vis absorption spectrum of [Ru(bpy) 3 ] 2+ , the gray area being the excitation energy range of the launched trajectories. b Time-resolved (over 30 fs) normalized singlet
(bluish) and triplet (brownish) populations. Panels B–E display normalized total singlet and triplet
populations under different conditions (see text). Reprinted with permission from [69]. Copyright
2018 American chemical society
Fig. 6 a Total standard deviation of relevant normal modes of [Ru(bpy) 3 ] 2+ for an averaged trajectory at different time intervals. b Most relevant normal modes selected from the standard deviation
of the averaged trajectory (Fig. 6a). Reprinted with permission from [69]. Copyright 2018 American
chemical society
tifying the normal modes that show more significant changes over time, see, e.g.,
modes 33, 60, and 66 in Fig. 6b; and thus, they correspond to the modes that influence
most the ISC processes. Importantly, these modes are low-frequency ones and involve
hydrogen bond bending, but also Ru–N bond stretching in some cases. The motions
in the nitrogen and ruthenium atoms are thus the most important ones promoting ISC
through ES mixing.
3.3 Anti-Kasha Emissions in Ru(II) Complexes: Kinetic
Control of Photoluminescence or Solvent Effects?
The next computational work [99] is chosen to highlight the often intricate nature
of the emissive processes of TMCs, leading in some cases to, e.g., dual photoluminescence and/or anti-Kasha emissions (i.e., emission from higher-lying ESs). In
D. Escudero
Fig. 5 a Calculated UV-vis absorption spectrum of [Ru(bpy) 3 ] 2+ , the gray area being the excitation energy range of the launched trajectories. b Time-resolved (over 30 fs) normalized singlet
(bluish) and triplet (brownish) populations. Panels B–E display normalized total singlet and triplet
populations under different conditions (see text). Reprinted with permission from [69]. Copyright
2018 American chemical society
Fig. 6 a Total standard deviation of relevant normal modes of [Ru(bpy) 3 ] 2+ for an averaged trajectory at different time intervals. b Most relevant normal modes selected from the standard deviation
of the averaged trajectory (Fig. 6a). Reprinted with permission from [69]. Copyright 2018 American
chemical society
tifying the normal modes that show more significant changes over time, see, e.g.,
modes 33, 60, and 66 in Fig. 6b; and thus, they correspond to the modes that influence
most the ISC processes. Importantly, these modes are low-frequency ones and involve
hydrogen bond bending, but also Ru–N bond stretching in some cases. The motions
in the nitrogen and ruthenium atoms are thus the most important ones promoting ISC
through ES mixing.
3.3 Anti-Kasha Emissions in Ru(II) Complexes: Kinetic
Control of Photoluminescence or Solvent Effects?
The next computational work [99] is chosen to highlight the often intricate nature
of the emissive processes of TMCs, leading in some cases to, e.g., dual photoluminescence and/or anti-Kasha emissions (i.e., emission from higher-lying ESs). In