

Assessing Electronically Excited States of Cobalamins …
251
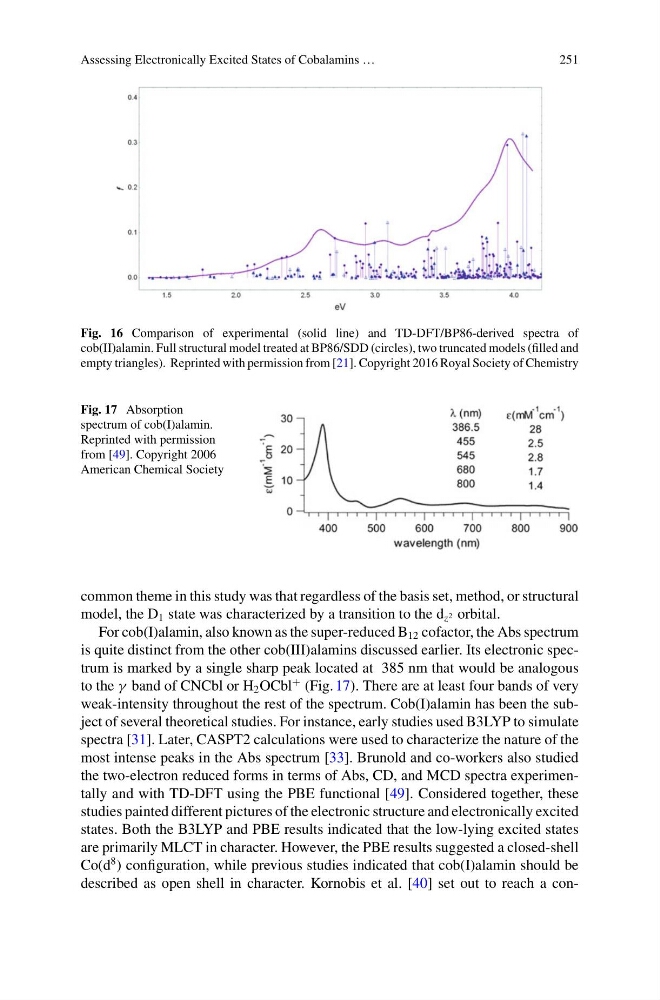
Fig. 16 Comparison of experimental (solid line) and TD-DFT/BP86-derived spectra of
cob(II)alamin. Full structural model treated at BP86/SDD (circles), two truncated models (filled and
empty triangles). Reprinted with permission from [21]. Copyright 2016 Royal Society of Chemistry
Fig. 17 Absorption
spectrum of cob(I)alamin.
Reprinted with permission
from [49]. Copyright 2006
American Chemical Society
common theme in this study was that regardless of the basis set, method, or structural
model, the D 1 state was characterized by a transition to the d z 2 orbital.
For cob(I)alamin, also known as the super-reduced B 12 cofactor, the Abs spectrum
is quite distinct from the other cob(III)alamins discussed earlier. Its electronic spectrum is marked by a single sharp peak located at 385 nm that would be analogous
to the γ band of CNCbl or H 2 OCbl
+ (Fig. 17). There are at least four bands of very
weak-intensity throughout the rest of the spectrum. Cob(I)alamin has been the subject of several theoretical studies. For instance, early studies used B3LYP to simulate
spectra [31]. Later, CASPT2 calculations were used to characterize the nature of the
most intense peaks in the Abs spectrum [33]. Brunold and co-workers also studied
the two-electron reduced forms in terms of Abs, CD, and MCD spectra experimentally and with TD-DFT using the PBE functional [49]. Considered together, these
studies painted different pictures of the electronic structure and electronically excited
states. Both the B3LYP and PBE results indicated that the low-lying excited states
are primarily MLCT in character. However, the PBE results suggested a closed-shell
Co(d
8 ) configuration, while previous studies indicated that cob(I)alamin should be
described as open shell in character. Kornobis et al. [40] set out to reach a con-
251
Fig. 16 Comparison of experimental (solid line) and TD-DFT/BP86-derived spectra of
cob(II)alamin. Full structural model treated at BP86/SDD (circles), two truncated models (filled and
empty triangles). Reprinted with permission from [21]. Copyright 2016 Royal Society of Chemistry
Fig. 17 Absorption
spectrum of cob(I)alamin.
Reprinted with permission
from [49]. Copyright 2006
American Chemical Society
common theme in this study was that regardless of the basis set, method, or structural
model, the D 1 state was characterized by a transition to the d z 2 orbital.
For cob(I)alamin, also known as the super-reduced B 12 cofactor, the Abs spectrum
is quite distinct from the other cob(III)alamins discussed earlier. Its electronic spectrum is marked by a single sharp peak located at 385 nm that would be analogous
to the γ band of CNCbl or H 2 OCbl
+ (Fig. 17). There are at least four bands of very
weak-intensity throughout the rest of the spectrum. Cob(I)alamin has been the subject of several theoretical studies. For instance, early studies used B3LYP to simulate
spectra [31]. Later, CASPT2 calculations were used to characterize the nature of the
most intense peaks in the Abs spectrum [33]. Brunold and co-workers also studied
the two-electron reduced forms in terms of Abs, CD, and MCD spectra experimentally and with TD-DFT using the PBE functional [49]. Considered together, these
studies painted different pictures of the electronic structure and electronically excited
states. Both the B3LYP and PBE results indicated that the low-lying excited states
are primarily MLCT in character. However, the PBE results suggested a closed-shell
Co(d
8 ) configuration, while previous studies indicated that cob(I)alamin should be
described as open shell in character. Kornobis et al. [40] set out to reach a con-