

Assessing Electronically Excited States of Cobalamins …
225
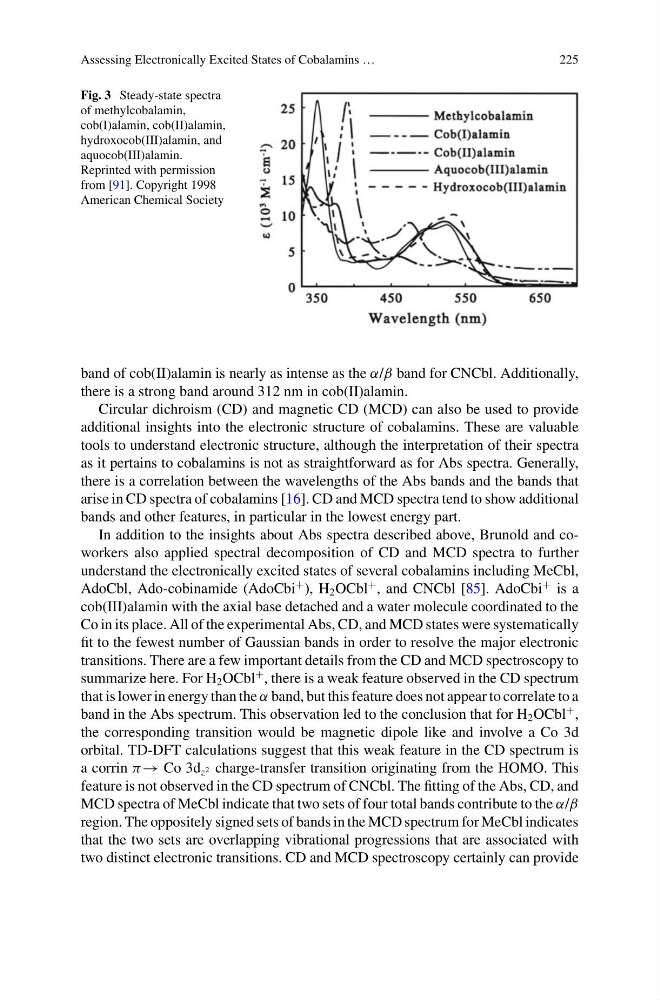
Fig. 3 Steady-state spectra
of methylcobalamin,
cob(I)alamin, cob(II)alamin,
hydroxocob(III)alamin, and
aquocob(III)alamin.
Reprinted with permission
from [91]. Copyright 1998
American Chemical Society
band of cob(II)alamin is nearly as intense as the α/β band for CNCbl. Additionally,
there is a strong band around 312 nm in cob(II)alamin.
Circular dichroism (CD) and magnetic CD (MCD) can also be used to provide
additional insights into the electronic structure of cobalamins. These are valuable
tools to understand electronic structure, although the interpretation of their spectra
as it pertains to cobalamins is not as straightforward as for Abs spectra. Generally,
there is a correlation between the wavelengths of the Abs bands and the bands that
arise in CD spectra of cobalamins [16]. CD and MCD spectra tend to show additional
bands and other features, in particular in the lowest energy part.
In addition to the insights about Abs spectra described above, Brunold and coworkers also applied spectral decomposition of CD and MCD spectra to further
understand the electronically excited states of several cobalamins including MeCbl,
AdoCbl, Ado-cobinamide (AdoCbi
+ ), H 2 OCbl
+ , and CNCbl [85]. AdoCbi
+ is a
cob(III)alamin with the axial base detached and a water molecule coordinated to the
Co in its place. All of the experimental Abs, CD, and MCD states were systematically
fit to the fewest number of Gaussian bands in order to resolve the major electronic
transitions. There are a few important details from the CD and MCD spectroscopy to
summarize here. For H 2 OCbl
+ , there is a weak feature observed in the CD spectrum
that is lower in energy than the α band, but this feature does not appear to correlate to a
band in the Abs spectrum. This observation led to the conclusion that for H 2 OCbl
+ ,
the corresponding transition would be magnetic dipole like and involve a Co 3d
orbital. TD-DFT calculations suggest that this weak feature in the CD spectrum is
a corrin π → Co 3d z 2 charge-transfer transition originating from the HOMO. This
feature is not observed in the CD spectrum of CNCbl. The fitting of the Abs, CD, and
MCD spectra of MeCbl indicate that two sets of four total bands contribute to the α/β
region. The oppositely signed sets of bands in the MCD spectrum for MeCbl indicates
that the two sets are overlapping vibrational progressions that are associated with
two distinct electronic transitions. CD and MCD spectroscopy certainly can provide
225
Fig. 3 Steady-state spectra
of methylcobalamin,
cob(I)alamin, cob(II)alamin,
hydroxocob(III)alamin, and
aquocob(III)alamin.
Reprinted with permission
from [91]. Copyright 1998
American Chemical Society
band of cob(II)alamin is nearly as intense as the α/β band for CNCbl. Additionally,
there is a strong band around 312 nm in cob(II)alamin.
Circular dichroism (CD) and magnetic CD (MCD) can also be used to provide
additional insights into the electronic structure of cobalamins. These are valuable
tools to understand electronic structure, although the interpretation of their spectra
as it pertains to cobalamins is not as straightforward as for Abs spectra. Generally,
there is a correlation between the wavelengths of the Abs bands and the bands that
arise in CD spectra of cobalamins [16]. CD and MCD spectra tend to show additional
bands and other features, in particular in the lowest energy part.
In addition to the insights about Abs spectra described above, Brunold and coworkers also applied spectral decomposition of CD and MCD spectra to further
understand the electronically excited states of several cobalamins including MeCbl,
AdoCbl, Ado-cobinamide (AdoCbi
+ ), H 2 OCbl
+ , and CNCbl [85]. AdoCbi
+ is a
cob(III)alamin with the axial base detached and a water molecule coordinated to the
Co in its place. All of the experimental Abs, CD, and MCD states were systematically
fit to the fewest number of Gaussian bands in order to resolve the major electronic
transitions. There are a few important details from the CD and MCD spectroscopy to
summarize here. For H 2 OCbl
+ , there is a weak feature observed in the CD spectrum
that is lower in energy than the α band, but this feature does not appear to correlate to a
band in the Abs spectrum. This observation led to the conclusion that for H 2 OCbl
+ ,
the corresponding transition would be magnetic dipole like and involve a Co 3d
orbital. TD-DFT calculations suggest that this weak feature in the CD spectrum is
a corrin π → Co 3d z 2 charge-transfer transition originating from the HOMO. This
feature is not observed in the CD spectrum of CNCbl. The fitting of the Abs, CD, and
MCD spectra of MeCbl indicate that two sets of four total bands contribute to the α/β
region. The oppositely signed sets of bands in the MCD spectrum for MeCbl indicates
that the two sets are overlapping vibrational progressions that are associated with
two distinct electronic transitions. CD and MCD spectroscopy certainly can provide