

Assessing Electronically Excited States of Cobalamins …
223
3 Importance of Abs, CD, and MCD Spectroscopy
It has been known for a long time that the features of Abs spectra of cobalamins
arise from the oxidation state of the Co as well as the nature of the upper and lower
axial ligands. The changes in the spectrum that accompany changes in oxidation
and ligation have been intensively scrutinized. Again, we refer to Giannotti [24] and
Pratt’s [68] contributions for a more detailed discussion. Herein, for convenience
of presentation, it is important to mention characteristic features of Abs spectra
of several cobalamins, such as CNCbl, AdoCbl, cob(II)alamin, or cob(I)alamin as
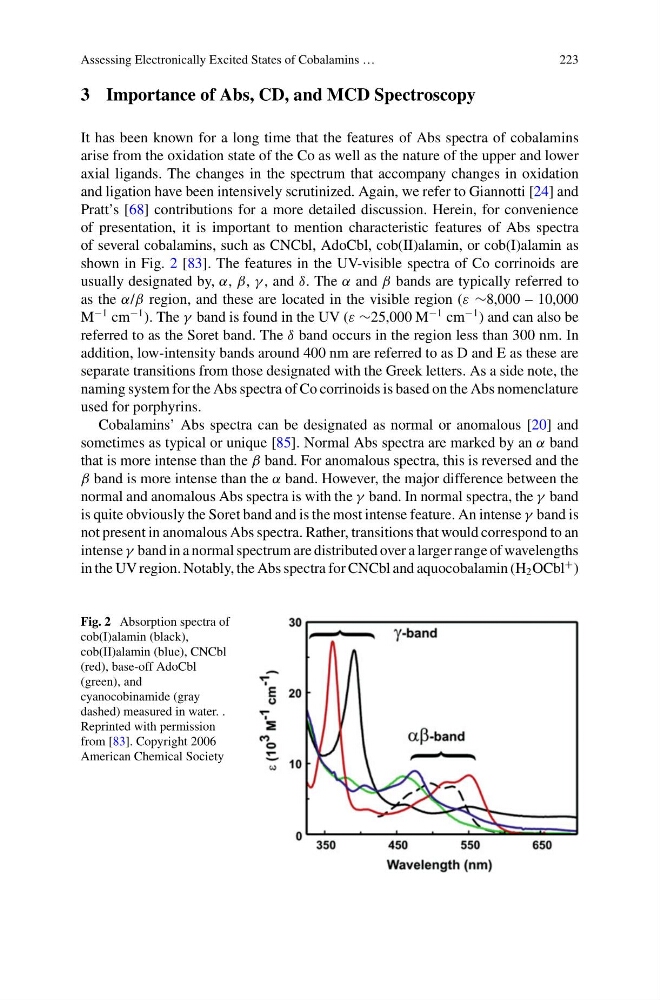
shown in Fig. 2 [83]. The features in the UV-visible spectra of Co corrinoids are
usually designated by, α, β, γ , and δ. The α and β bands are typically referred to
as the α/β region, and these are located in the visible region (ε ∼8,000 – 10,000
M
−1 cm
−1 ). The γ band is found in the UV (ε ∼25,000 M
−1 cm
−1 ) and can also be
referred to as the Soret band. The δ band occurs in the region less than 300 nm. In
addition, low-intensity bands around 400 nm are referred to as D and E as these are
separate transitions from those designated with the Greek letters. As a side note, the
naming system for the Abs spectra of Co corrinoids is based on the Abs nomenclature
used for porphyrins.
Cobalamins’ Abs spectra can be designated as normal or anomalous [20] and
sometimes as typical or unique [85]. Normal Abs spectra are marked by an α band
that is more intense than the β band. For anomalous spectra, this is reversed and the
β band is more intense than the α band. However, the major difference between the
normal and anomalous Abs spectra is with the γ band. In normal spectra, the γ band
is quite obviously the Soret band and is the most intense feature. An intense γ band is
not present in anomalous Abs spectra. Rather, transitions that would correspond to an
intense γ band in a normal spectrum are distributed over a larger range of wavelengths
in the UV region. Notably, the Abs spectra for CNCbl and aquocobalamin (H 2 OCbl
+ )
Fig. 2 Absorption spectra of
cob(I)alamin (black),
cob(II)alamin (blue), CNCbl
(red), base-off AdoCbl
(green), and
cyanocobinamide (gray
dashed) measured in water. .
Reprinted with permission
from [83]. Copyright 2006
American Chemical Society
223
3 Importance of Abs, CD, and MCD Spectroscopy
It has been known for a long time that the features of Abs spectra of cobalamins
arise from the oxidation state of the Co as well as the nature of the upper and lower
axial ligands. The changes in the spectrum that accompany changes in oxidation
and ligation have been intensively scrutinized. Again, we refer to Giannotti [24] and
Pratt’s [68] contributions for a more detailed discussion. Herein, for convenience
of presentation, it is important to mention characteristic features of Abs spectra
of several cobalamins, such as CNCbl, AdoCbl, cob(II)alamin, or cob(I)alamin as
shown in Fig. 2 [83]. The features in the UV-visible spectra of Co corrinoids are
usually designated by, α, β, γ , and δ. The α and β bands are typically referred to
as the α/β region, and these are located in the visible region (ε ∼8,000 – 10,000
M
−1 cm
−1 ). The γ band is found in the UV (ε ∼25,000 M
−1 cm
−1 ) and can also be
referred to as the Soret band. The δ band occurs in the region less than 300 nm. In
addition, low-intensity bands around 400 nm are referred to as D and E as these are
separate transitions from those designated with the Greek letters. As a side note, the
naming system for the Abs spectra of Co corrinoids is based on the Abs nomenclature
used for porphyrins.
Cobalamins’ Abs spectra can be designated as normal or anomalous [20] and
sometimes as typical or unique [85]. Normal Abs spectra are marked by an α band
that is more intense than the β band. For anomalous spectra, this is reversed and the
β band is more intense than the α band. However, the major difference between the
normal and anomalous Abs spectra is with the γ band. In normal spectra, the γ band
is quite obviously the Soret band and is the most intense feature. An intense γ band is
not present in anomalous Abs spectra. Rather, transitions that would correspond to an
intense γ band in a normal spectrum are distributed over a larger range of wavelengths
in the UV region. Notably, the Abs spectra for CNCbl and aquocobalamin (H 2 OCbl
+ )
Fig. 2 Absorption spectra of
cob(I)alamin (black),
cob(II)alamin (blue), CNCbl
(red), base-off AdoCbl
(green), and
cyanocobinamide (gray
dashed) measured in water. .
Reprinted with permission
from [83]. Copyright 2006
American Chemical Society