

9.10 Control Charts
165
Average [mg/L]
Average [mg/L]
Measurement number
Measurement number
Average control chart
Range control chart
+3SD
+3SD
-3SD
-2SD
+2SD
+2SD
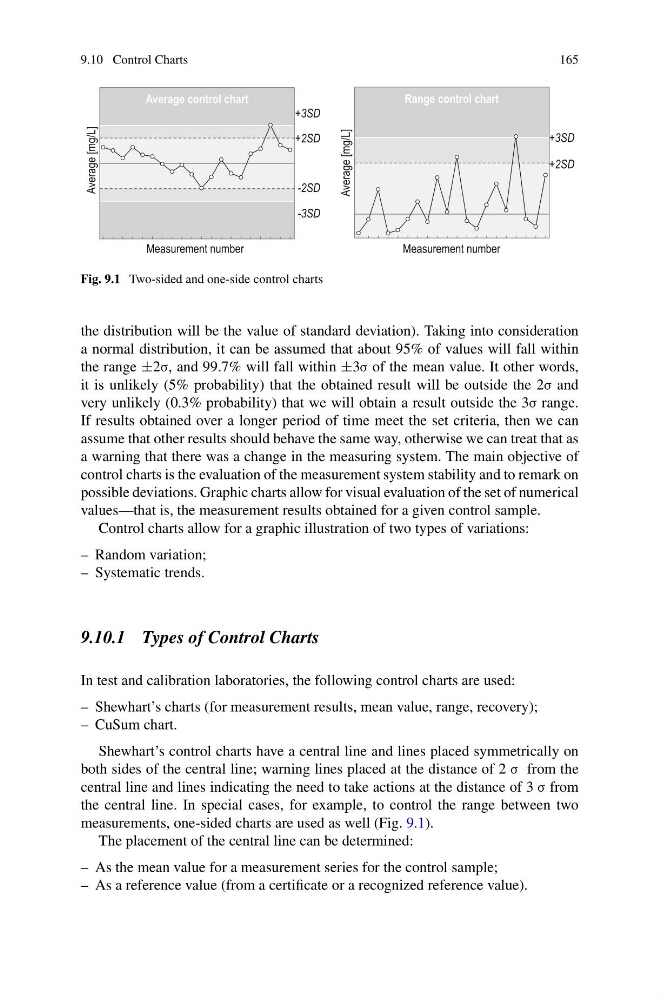
Fig. 9.1 Two-sided and one-side control charts
the distribution will be the value of standard deviation). Taking into consideration
a normal distribution, it can be assumed that about 95% of values will fall within
the range ±2σ, and 99.7% will fall within ±3σ of the mean value. It other words,
it is unlikely (5% probability) that the obtained result will be outside the 2σ and
very unlikely (0.3% probability) that we will obtain a result outside the 3σ range.
If results obtained over a longer period of time meet the set criteria, then we can
assume that other results should behave the same way, otherwise we can treat that as
a warning that there was a change in the measuring system. The main objective of
control charts is the evaluation of the measurement system stability and to remark on
possible deviations. Graphic charts allow for visual evaluation of the set of numerical
values—that is, the measurement results obtained for a given control sample.
Control charts allow for a graphic illustration of two types of variations:
– Random variation;
– Systematic trends.
9.10.1 Types of Control Charts
In test and calibration laboratories, the following control charts are used:
– Shewhart’s charts (for measurement results, mean value, range, recovery);
– CuSum chart.
Shewhart’s control charts have a central line and lines placed symmetrically on
both sides of the central line; warning lines placed at the distance of 2 σ from the
central line and lines indicating the need to take actions at the distance of 3 σ from
the central line. In special cases, for example, to control the range between two
measurements, one-sided charts are used as well (Fig. 9.1).
The placement of the central line can be determined:
– As the mean value for a measurement series for the control sample;
– As a reference value (from a certificate or a recognized reference value).
165
Average [mg/L]
Average [mg/L]
Measurement number
Measurement number
Average control chart
Range control chart
+3SD
+3SD
-3SD
-2SD
+2SD
+2SD
Fig. 9.1 Two-sided and one-side control charts
the distribution will be the value of standard deviation). Taking into consideration
a normal distribution, it can be assumed that about 95% of values will fall within
the range ±2σ, and 99.7% will fall within ±3σ of the mean value. It other words,
it is unlikely (5% probability) that the obtained result will be outside the 2σ and
very unlikely (0.3% probability) that we will obtain a result outside the 3σ range.
If results obtained over a longer period of time meet the set criteria, then we can
assume that other results should behave the same way, otherwise we can treat that as
a warning that there was a change in the measuring system. The main objective of
control charts is the evaluation of the measurement system stability and to remark on
possible deviations. Graphic charts allow for visual evaluation of the set of numerical
values—that is, the measurement results obtained for a given control sample.
Control charts allow for a graphic illustration of two types of variations:
– Random variation;
– Systematic trends.
9.10.1 Types of Control Charts
In test and calibration laboratories, the following control charts are used:
– Shewhart’s charts (for measurement results, mean value, range, recovery);
– CuSum chart.
Shewhart’s control charts have a central line and lines placed symmetrically on
both sides of the central line; warning lines placed at the distance of 2 σ from the
central line and lines indicating the need to take actions at the distance of 3 σ from
the central line. In special cases, for example, to control the range between two
measurements, one-sided charts are used as well (Fig. 9.1).
The placement of the central line can be determined:
– As the mean value for a measurement series for the control sample;
– As a reference value (from a certificate or a recognized reference value).