

was ultra-sonicated for half an hour. After that, the solvent of the 2D composite was
slowly evaporated at room temperature for 8 h to obtain hydrogels. With the
reduction proceeding of the evaporation, which induced self-assembly process, the
π-conjugated structures of reduced GO sheets were growing larger and larger, which
would increase the amount of π–π stacking cross-links between graphene sheets. As
a result, the partial overlapping or coalescing of flexible graphene sheets is formed
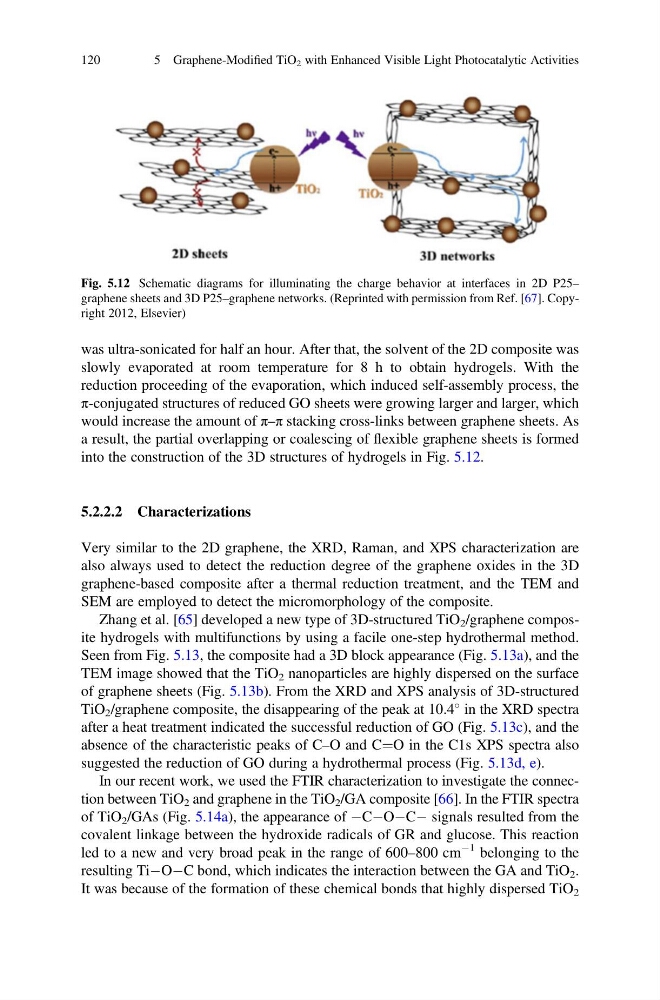
into the construction of the 3D structures of hydrogels in Fig. 5.12.
5.2.2.2 Characterizations
Very similar to the 2D graphene, the XRD, Raman, and XPS characterization are
also always used to detect the reduction degree of the graphene oxides in the 3D
graphene-based composite after a thermal reduction treatment, and the TEM and
SEM are employed to detect the micromorphology of the composite.
Zhang et al. [65] developed a new type of 3D-structured TiO 2 /graphene composite hydrogels with multifunctions by using a facile one-step hydrothermal method.
Seen from Fig. 5.13, the composite had a 3D block appearance (Fig. 5.13a), and the
TEM image showed that the TiO 2 nanoparticles are highly dispersed on the surface
of graphene sheets (Fig. 5.13b). From the XRD and XPS analysis of 3D-structured
TiO 2 /graphene composite, the disappearing of the peak at 10.4
in the XRD spectra
after a heat treatment indicated the successful reduction of GO (Fig. 5.13c), and the
absence of the characteristic peaks of C–O and C¼O in the C1s XPS spectra also
suggested the reduction of GO during a hydrothermal process (Fig. 5.13d, e).
In our recent work, we used the FTIR characterization to investigate the connection between TiO 2 and graphene in the TiO 2 /GA composite [66]. In the FTIR spectra
of TiO 2 /GAs (Fig. 5.14a), the appearance of ÀCÀOÀCÀ signals resulted from the
covalent linkage between the hydroxide radicals of GR and glucose. This reaction
led to a new and very broad peak in the range of 600–800 cm
À1 belonging to the
resulting TiÀOÀC bond, which indicates the interaction between the GA and TiO 2 .
It was because of the formation of these chemical bonds that highly dispersed TiO 2
Fig. 5.12 Schematic diagrams for illuminating the charge behavior at interfaces in 2D P25–
graphene sheets and 3D P25–graphene networks. (Reprinted with permission from Ref. [67]. Copyright 2012, Elsevier)
120
5 Graphene-Modified TiO 2 with Enhanced Visible Light Photocatalytic Activities
slowly evaporated at room temperature for 8 h to obtain hydrogels. With the
reduction proceeding of the evaporation, which induced self-assembly process, the
π-conjugated structures of reduced GO sheets were growing larger and larger, which
would increase the amount of π–π stacking cross-links between graphene sheets. As
a result, the partial overlapping or coalescing of flexible graphene sheets is formed
into the construction of the 3D structures of hydrogels in Fig. 5.12.
5.2.2.2 Characterizations
Very similar to the 2D graphene, the XRD, Raman, and XPS characterization are
also always used to detect the reduction degree of the graphene oxides in the 3D
graphene-based composite after a thermal reduction treatment, and the TEM and
SEM are employed to detect the micromorphology of the composite.
Zhang et al. [65] developed a new type of 3D-structured TiO 2 /graphene composite hydrogels with multifunctions by using a facile one-step hydrothermal method.
Seen from Fig. 5.13, the composite had a 3D block appearance (Fig. 5.13a), and the
TEM image showed that the TiO 2 nanoparticles are highly dispersed on the surface
of graphene sheets (Fig. 5.13b). From the XRD and XPS analysis of 3D-structured
TiO 2 /graphene composite, the disappearing of the peak at 10.4
in the XRD spectra
after a heat treatment indicated the successful reduction of GO (Fig. 5.13c), and the
absence of the characteristic peaks of C–O and C¼O in the C1s XPS spectra also
suggested the reduction of GO during a hydrothermal process (Fig. 5.13d, e).
In our recent work, we used the FTIR characterization to investigate the connection between TiO 2 and graphene in the TiO 2 /GA composite [66]. In the FTIR spectra
of TiO 2 /GAs (Fig. 5.14a), the appearance of ÀCÀOÀCÀ signals resulted from the
covalent linkage between the hydroxide radicals of GR and glucose. This reaction
led to a new and very broad peak in the range of 600–800 cm
À1 belonging to the
resulting TiÀOÀC bond, which indicates the interaction between the GA and TiO 2 .
It was because of the formation of these chemical bonds that highly dispersed TiO 2
Fig. 5.12 Schematic diagrams for illuminating the charge behavior at interfaces in 2D P25–
graphene sheets and 3D P25–graphene networks. (Reprinted with permission from Ref. [67]. Copyright 2012, Elsevier)
120
5 Graphene-Modified TiO 2 with Enhanced Visible Light Photocatalytic Activities