

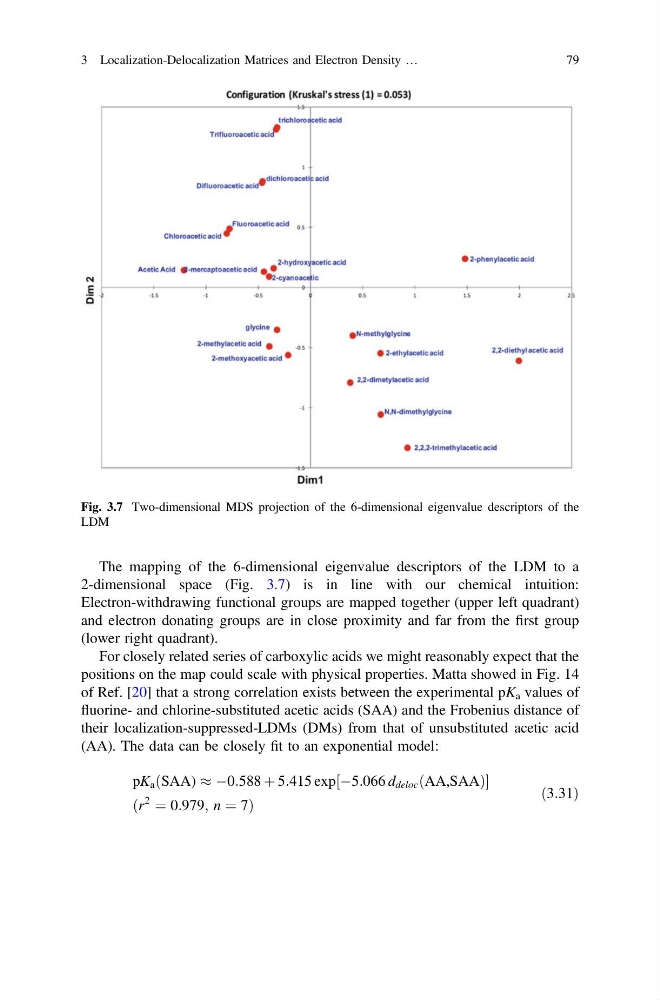
The mapping of the 6-dimensional eigenvalue descriptors of the LDM to a
2-dimensional space (Fig. 3.7) is in line with our chemical intuition:
Electron-withdrawing functional groups are mapped together (upper left quadrant)
and electron donating groups are in close proximity and far from the first group
(lower right quadrant).
For closely related series of carboxylic acids we might reasonably expect that the
positions on the map could scale with physical properties. Matta showed in Fig. 14
of Ref. [20] that a strong correlation exists between the experimental pK a values of
fluorine- and chlorine-substituted acetic acids (SAA) and the Frobenius distance of
their localization-suppressed-LDMs (DMs) from that of unsubstituted acetic acid
(AA). The data can be closely fit to an exponential model:
pK a ðSAA) % À0:588 þ 5:415 exp½À5:066 d deloc ðAA,SAAÞ
ðr
2
¼ 0:979; n ¼ 7Þ
ð3:31Þ
Fig. 3.7 Two-dimensional MDS projection of the 6-dimensional eigenvalue descriptors of the
LDM
3 Localization-Delocalization Matrices and Electron Density …
79
2-dimensional space (Fig. 3.7) is in line with our chemical intuition:
Electron-withdrawing functional groups are mapped together (upper left quadrant)
and electron donating groups are in close proximity and far from the first group
(lower right quadrant).
For closely related series of carboxylic acids we might reasonably expect that the
positions on the map could scale with physical properties. Matta showed in Fig. 14
of Ref. [20] that a strong correlation exists between the experimental pK a values of
fluorine- and chlorine-substituted acetic acids (SAA) and the Frobenius distance of
their localization-suppressed-LDMs (DMs) from that of unsubstituted acetic acid
(AA). The data can be closely fit to an exponential model:
pK a ðSAA) % À0:588 þ 5:415 exp½À5:066 d deloc ðAA,SAAÞ
ðr
2
¼ 0:979; n ¼ 7Þ
ð3:31Þ
Fig. 3.7 Two-dimensional MDS projection of the 6-dimensional eigenvalue descriptors of the
LDM
3 Localization-Delocalization Matrices and Electron Density …
79