

given member of the molecular set and this reference is a measure of their dissimilarity and assumed to reflect the dissimilarity of their properties.
The molecule chosen as reference for the property “pK a ” is taken to be the most
acidic, that is, the molecule exhibiting the lowest pK a value—which is p-nitrobenzoic acid [pK a (BANO 2 ) = 3.44]. In the case of the property “λ max ”, the
reference is taken to be the unsubstituted benzoic acid as it exhibits the smallest
value [λ max (BA) = 230 nm].
The diagonal elements of the LDM, the LIs, are usually the matrix elements with
the largest magnitudes. The sum of the LIs often represent 70–90 % of the electron
population of a molecule and hence the trace of the LDM is a size-sensitive
property that can bias properties that are primarily driven electronically (e.g. pK a ).
In these cases where the property of interest is clearly determined by electronic
properties and is size-independent, the diagonal suppressed LDM, namely the
delocalization matrix (or DM), can be a better fingerprinting tool as this example
demonstrates [20, 21].
The squared correlation coefficients (r
2 ) of linear fits of the Frobenius distances
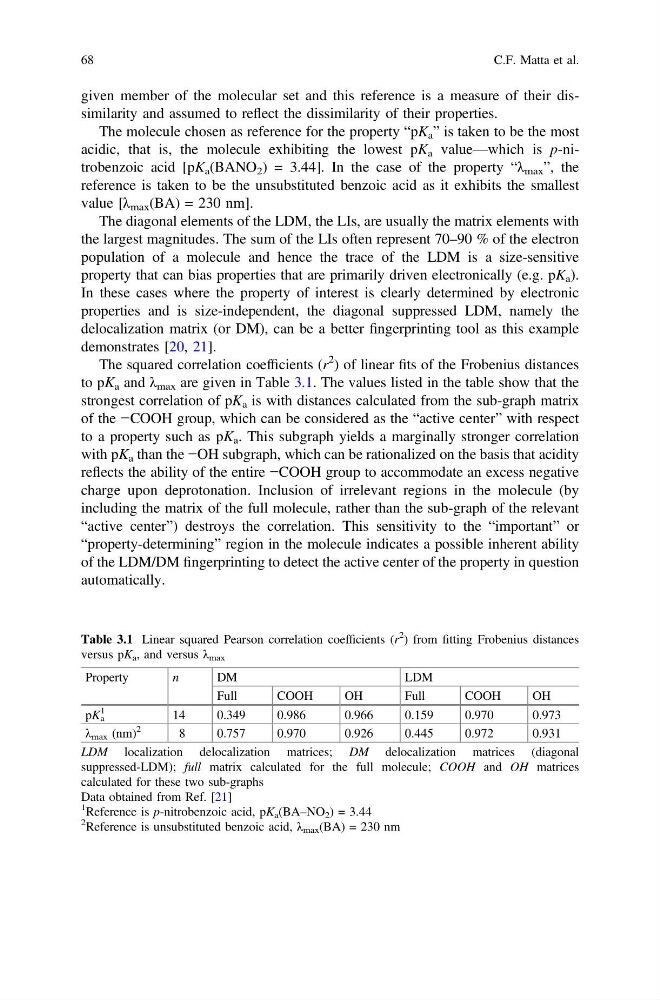
to pK a and λ max are given in Table 3.1. The values listed in the table show that the
strongest correlation of pK a is with distances calculated from the sub-graph matrix
of the −COOH group, which can be considered as the “active center” with respect
to a property such as pK a . This subgraph yields a marginally stronger correlation
with pK a than the −OH subgraph, which can be rationalized on the basis that acidity
reflects the ability of the entire −COOH group to accommodate an excess negative
charge upon deprotonation. Inclusion of irrelevant regions in the molecule (by
including the matrix of the full molecule, rather than the sub-graph of the relevant
“active center”) destroys the correlation. This sensitivity to the “important” or
“property-determining” region in the molecule indicates a possible inherent ability
of the LDM/DM fingerprinting to detect the active center of the property in question
automatically.
Table 3.1 Linear squared Pearson correlation coefficients (r
2
) from fitting Frobenius distances
versus pK a , and versus λ max
Property
n
DM
LDM
Full
COOH
OH
Full
COOH
OH
pK a
1
14
0.349
0.986
0.966
0.159
0.970
0.973
λ max (nm)
2
8
0.757
0.970
0.926
0.445
0.972
0.931
LDM localization delocalization matrices; DM delocalization matrices (diagonal
suppressed-LDM); full matrix calculated for the full molecule; COOH and OH matrices
calculated for these two sub-graphs
Data obtained from Ref. [21]
1
Reference is p-nitrobenzoic acid, pK a (BA–NO 2 ) = 3.44
2
Reference is unsubstituted benzoic acid, λ max (BA) = 230 nm
68
C.F. Matta et al.
The molecule chosen as reference for the property “pK a ” is taken to be the most
acidic, that is, the molecule exhibiting the lowest pK a value—which is p-nitrobenzoic acid [pK a (BANO 2 ) = 3.44]. In the case of the property “λ max ”, the
reference is taken to be the unsubstituted benzoic acid as it exhibits the smallest
value [λ max (BA) = 230 nm].
The diagonal elements of the LDM, the LIs, are usually the matrix elements with
the largest magnitudes. The sum of the LIs often represent 70–90 % of the electron
population of a molecule and hence the trace of the LDM is a size-sensitive
property that can bias properties that are primarily driven electronically (e.g. pK a ).
In these cases where the property of interest is clearly determined by electronic
properties and is size-independent, the diagonal suppressed LDM, namely the
delocalization matrix (or DM), can be a better fingerprinting tool as this example
demonstrates [20, 21].
The squared correlation coefficients (r
2 ) of linear fits of the Frobenius distances
to pK a and λ max are given in Table 3.1. The values listed in the table show that the
strongest correlation of pK a is with distances calculated from the sub-graph matrix
of the −COOH group, which can be considered as the “active center” with respect
to a property such as pK a . This subgraph yields a marginally stronger correlation
with pK a than the −OH subgraph, which can be rationalized on the basis that acidity
reflects the ability of the entire −COOH group to accommodate an excess negative
charge upon deprotonation. Inclusion of irrelevant regions in the molecule (by
including the matrix of the full molecule, rather than the sub-graph of the relevant
“active center”) destroys the correlation. This sensitivity to the “important” or
“property-determining” region in the molecule indicates a possible inherent ability
of the LDM/DM fingerprinting to detect the active center of the property in question
automatically.
Table 3.1 Linear squared Pearson correlation coefficients (r
2
) from fitting Frobenius distances
versus pK a , and versus λ max
Property
n
DM
LDM
Full
COOH
OH
Full
COOH
OH
pK a
1
14
0.349
0.986
0.966
0.159
0.970
0.973
λ max (nm)
2
8
0.757
0.970
0.926
0.445
0.972
0.931
LDM localization delocalization matrices; DM delocalization matrices (diagonal
suppressed-LDM); full matrix calculated for the full molecule; COOH and OH matrices
calculated for these two sub-graphs
Data obtained from Ref. [21]
1
Reference is p-nitrobenzoic acid, pK a (BA–NO 2 ) = 3.44
2
Reference is unsubstituted benzoic acid, λ max (BA) = 230 nm
68
C.F. Matta et al.