

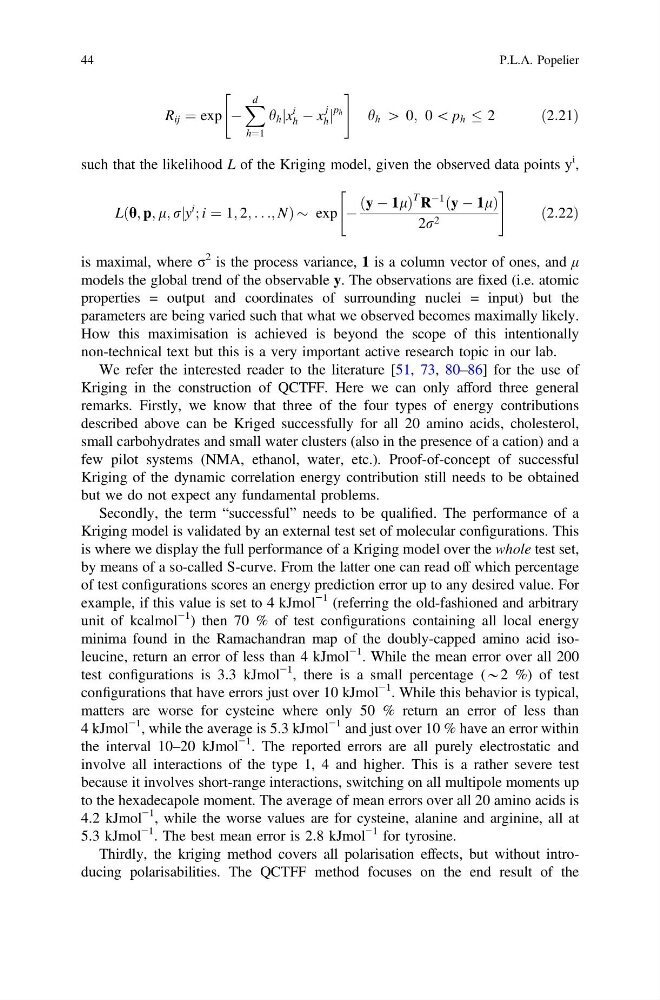
R ij ¼ exp À
X d
h¼1
h h jx
i
h À x
j
h j
p h
"
#
h h [ 0; 0 \ p h 2
ð2:21Þ
such that the likelihood L of the Kriging model, given the observed data points y
i ,
Lðh; p; l; rjy
i
; i ¼ 1; 2; . . .; NÞ $ exp À
ðy À 1lÞ
T R
À1
ðy À 1lÞ
2r 2
"
#
ð2:22Þ
is maximal, where σ
2 is the process variance, 1 is a column vector of ones, and μ
models the global trend of the observable y. The observations are fixed (i.e. atomic
properties = output and coordinates of surrounding nuclei = input) but the
parameters are being varied such that what we observed becomes maximally likely.
How this maximisation is achieved is beyond the scope of this intentionally
non-technical text but this is a very important active research topic in our lab.
We refer the interested reader to the literature [51, 73, 80–86] for the use of
Kriging in the construction of QCTFF. Here we can only afford three general
remarks. Firstly, we know that three of the four types of energy contributions
described above can be Kriged successfully for all 20 amino acids, cholesterol,
small carbohydrates and small water clusters (also in the presence of a cation) and a
few pilot systems (NMA, ethanol, water, etc.). Proof-of-concept of successful
Kriging of the dynamic correlation energy contribution still needs to be obtained
but we do not expect any fundamental problems.
Secondly, the term “successful” needs to be qualified. The performance of a
Kriging model is validated by an external test set of molecular configurations. This
is where we display the full performance of a Kriging model over the whole test set,
by means of a so-called S-curve. From the latter one can read off which percentage
of test configurations scores an energy prediction error up to any desired value. For
example, if this value is set to 4 kJmol
−1 (referring the old-fashioned and arbitrary
unit of kcalmol
−1 ) then 70 % of test configurations containing all local energy
minima found in the Ramachandran map of the doubly-capped amino acid isoleucine, return an error of less than 4 kJmol
−1 . While the mean error over all 200
test configurations is 3.3 kJmol
−1 , there is a small percentage (*2 %) of test
configurations that have errors just over 10 kJmol
−1 . While this behavior is typical,
matters are worse for cysteine where only 50 % return an error of less than
4 kJmol
−1 , while the average is 5.3 kJmol
−1 and just over 10 % have an error within
the interval 10–20 kJmol
−1 . The reported errors are all purely electrostatic and
involve all interactions of the type 1, 4 and higher. This is a rather severe test
because it involves short-range interactions, switching on all multipole moments up
to the hexadecapole moment. The average of mean errors over all 20 amino acids is
4.2 kJmol
−1 , while the worse values are for cysteine, alanine and arginine, all at
5.3 kJmol
−1 . The best mean error is 2.8 kJmol
−1 for tyrosine.
Thirdly, the kriging method covers all polarisation effects, but without introducing polarisabilities. The QCTFF method focuses on the end result of the
44
P.L.A. Popelier
X d
h¼1
h h jx
i
h À x
j
h j
p h
"
#
h h [ 0; 0 \ p h 2
ð2:21Þ
such that the likelihood L of the Kriging model, given the observed data points y
i ,
Lðh; p; l; rjy
i
; i ¼ 1; 2; . . .; NÞ $ exp À
ðy À 1lÞ
T R
À1
ðy À 1lÞ
2r 2
"
#
ð2:22Þ
is maximal, where σ
2 is the process variance, 1 is a column vector of ones, and μ
models the global trend of the observable y. The observations are fixed (i.e. atomic
properties = output and coordinates of surrounding nuclei = input) but the
parameters are being varied such that what we observed becomes maximally likely.
How this maximisation is achieved is beyond the scope of this intentionally
non-technical text but this is a very important active research topic in our lab.
We refer the interested reader to the literature [51, 73, 80–86] for the use of
Kriging in the construction of QCTFF. Here we can only afford three general
remarks. Firstly, we know that three of the four types of energy contributions
described above can be Kriged successfully for all 20 amino acids, cholesterol,
small carbohydrates and small water clusters (also in the presence of a cation) and a
few pilot systems (NMA, ethanol, water, etc.). Proof-of-concept of successful
Kriging of the dynamic correlation energy contribution still needs to be obtained
but we do not expect any fundamental problems.
Secondly, the term “successful” needs to be qualified. The performance of a
Kriging model is validated by an external test set of molecular configurations. This
is where we display the full performance of a Kriging model over the whole test set,
by means of a so-called S-curve. From the latter one can read off which percentage
of test configurations scores an energy prediction error up to any desired value. For
example, if this value is set to 4 kJmol
−1 (referring the old-fashioned and arbitrary
unit of kcalmol
−1 ) then 70 % of test configurations containing all local energy
minima found in the Ramachandran map of the doubly-capped amino acid isoleucine, return an error of less than 4 kJmol
−1 . While the mean error over all 200
test configurations is 3.3 kJmol
−1 , there is a small percentage (*2 %) of test
configurations that have errors just over 10 kJmol
−1 . While this behavior is typical,
matters are worse for cysteine where only 50 % return an error of less than
4 kJmol
−1 , while the average is 5.3 kJmol
−1 and just over 10 % have an error within
the interval 10–20 kJmol
−1 . The reported errors are all purely electrostatic and
involve all interactions of the type 1, 4 and higher. This is a rather severe test
because it involves short-range interactions, switching on all multipole moments up
to the hexadecapole moment. The average of mean errors over all 20 amino acids is
4.2 kJmol
−1 , while the worse values are for cysteine, alanine and arginine, all at
5.3 kJmol
−1 . The best mean error is 2.8 kJmol
−1 for tyrosine.
Thirdly, the kriging method covers all polarisation effects, but without introducing polarisabilities. The QCTFF method focuses on the end result of the
44
P.L.A. Popelier