

The SG for J
B induced by a field orthogonal to the molecular plane of ethene is
displayed in Fig. 7.9 and the corresponding streamlines are plotted in Fig. 7.10.
A contour map (in red) of the shielding density
X I
xx
ðrÞ ¼ À
l 0
4p
xbc
r b À R I b
j r À R I j
3
J
B x
c ðrÞ;
ð7:81Þ
defined via Eq. (7.81) for I = H is shown in Fig. 7.10 on the plane of the nuclei of
CH 2 –CH 2 . Red contours superimposed to the streamlines of the J
B
ðrÞ field provide
visual understanding of the local (shielding or deshielding) contributions at points
r on the plot plane [103]. Figure 7.10 shows that the largest proton shielding
component, r
H
xx ¼ 29:9 ppm, is essentially determined by local flow. Nearly vanishing contributions of opposite sign arise from closest and furthest portions of
distant current loops. An interesting set of phase portraits was observed for the
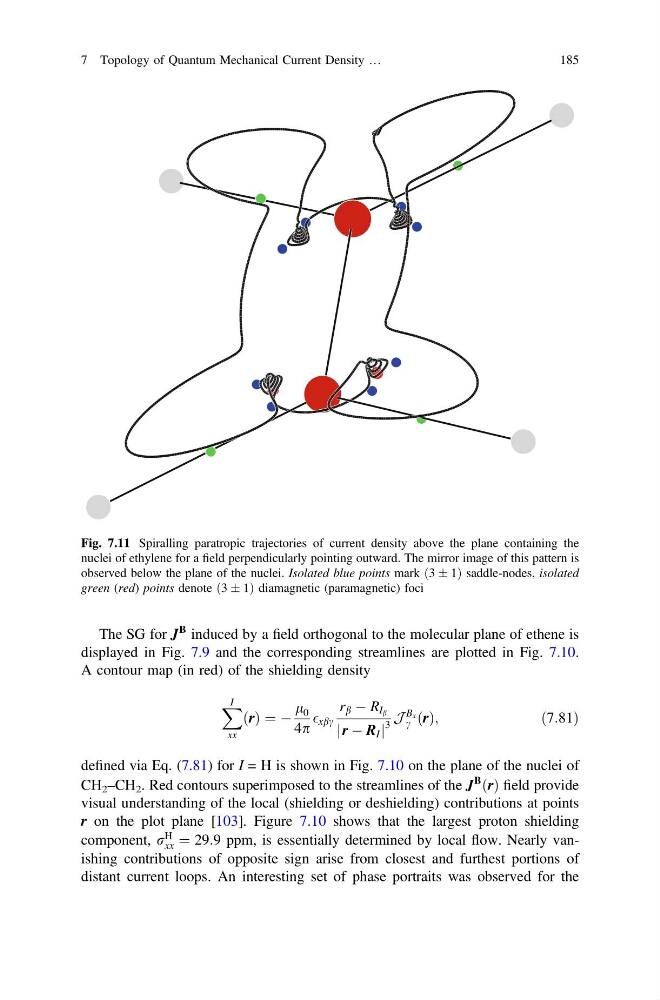
Fig. 7.11 Spiralling paratropic trajectories of current density above the plane containing the
nuclei of ethylene for a field perpendicularly pointing outward. The mirror image of this pattern is
observed below the plane of the nuclei. Isolated blue points mark ð3 Æ 1Þ saddle-nodes, isolated
green (red) points denote ð3 Æ 1Þ diamagnetic (paramagnetic) foci
7 Topology of Quantum Mechanical Current Density …
185
B induced by a field orthogonal to the molecular plane of ethene is
displayed in Fig. 7.9 and the corresponding streamlines are plotted in Fig. 7.10.
A contour map (in red) of the shielding density
X I
xx
ðrÞ ¼ À
l 0
4p
xbc
r b À R I b
j r À R I j
3
J
B x
c ðrÞ;
ð7:81Þ
defined via Eq. (7.81) for I = H is shown in Fig. 7.10 on the plane of the nuclei of
CH 2 –CH 2 . Red contours superimposed to the streamlines of the J
B
ðrÞ field provide
visual understanding of the local (shielding or deshielding) contributions at points
r on the plot plane [103]. Figure 7.10 shows that the largest proton shielding
component, r
H
xx ¼ 29:9 ppm, is essentially determined by local flow. Nearly vanishing contributions of opposite sign arise from closest and furthest portions of
distant current loops. An interesting set of phase portraits was observed for the
Fig. 7.11 Spiralling paratropic trajectories of current density above the plane containing the
nuclei of ethylene for a field perpendicularly pointing outward. The mirror image of this pattern is
observed below the plane of the nuclei. Isolated blue points mark ð3 Æ 1Þ saddle-nodes, isolated
green (red) points denote ð3 Æ 1Þ diamagnetic (paramagnetic) foci
7 Topology of Quantum Mechanical Current Density …
185