

associated with the atoms having the most electrons and the smallest eigenvalues
being generally associated with the hydrogen atoms. This observation provides a
route to reducing the high-dimensional complexity of the LDM to provide a set of
molecular descriptors for building quantitative structure property relationships
(QSPR) or quantitative structure activity relationships (QSAR).
One of us (RC) has begun to explore the use of Principal Component Analysis
(PCA) [74] to reduce the dimensions of the LDM and extract information from it to
build robust QSPRs and QSARs. In the PCA approach, a matrix containing entries
that may be statistically correlated is converted to an eigenvector, devoid of such
correlation between variables, composed of what is termed the “principal components (PCs)”. The PCs may be equal in number to the original variables or can be
lesser. The first PC is the one with maximal variance followed by PCs that maximize the variance subject to the constraint of being orthogonal to all previous PCs.
The PCs are, thus, orthogonal (and uncorrelated) by construction and represent
the eigenvectors of the (symmetric) covariance matrix. Each of these eigenvectors
can be thought of as one of n-axes of an n-D ellipse. Axes of this ellipse that are
small mean that the corresponding variance along that axis is also small. We can
then neglect axes smaller than a given threshold (and its corresponding PC) from
the representation of the LDM without losing much information.
As mentioned above we have observed that there is a strong correlation between
the eigenvalues of the LDM and the number of electrons in the atom basins. The
hydrogen atoms have the smallest number of electrons and therefore within the
dimensionality reducing transformations of the PCA, we will be able to effectively
ignore their contributions to the eigenvalues extracted from the LDM by the PCA
transformation. Functionally, this is equivalent to the hydrogen suppressed structure
used by Kier and Hall to develop their “Atom Level Electrotopological State” [75].
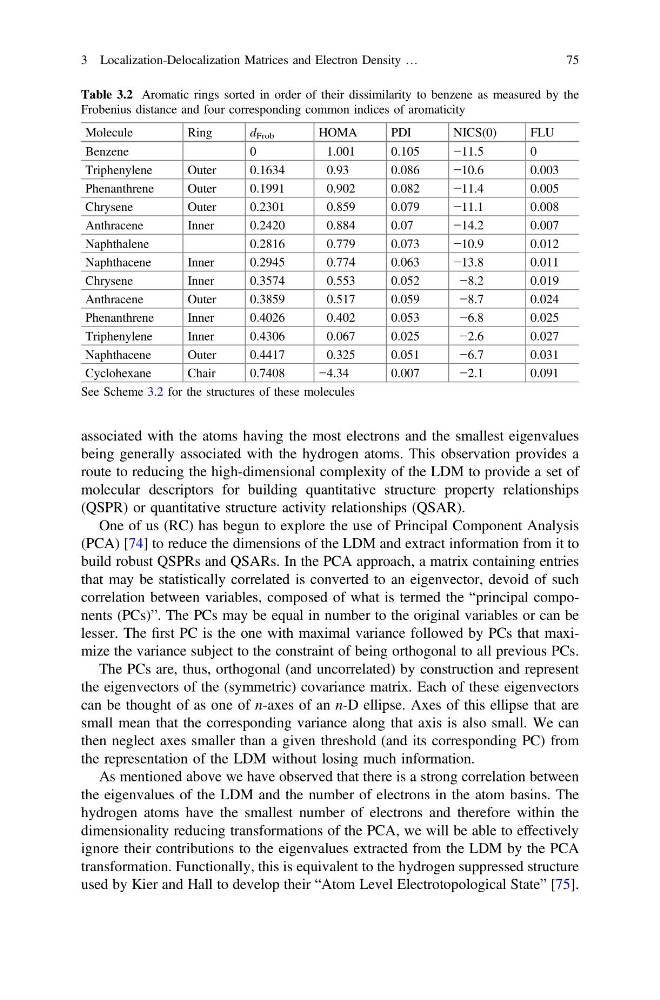
Table 3.2 Aromatic rings sorted in order of their dissimilarity to benzene as measured by the
Frobenius distance and four corresponding common indices of aromaticity
Molecule
Ring
d Frob
HOMA
PDI
NICS(0)
FLU
Benzene
0
1.001
0.105
−11.5
0
Triphenylene
Outer
0.1634
0.93
0.086
−10.6
0.003
Phenanthrene
Outer
0.1991
0.902
0.082
−11.4
0.005
Chrysene
Outer
0.2301
0.859
0.079
−11.1
0.008
Anthracene
Inner
0.2420
0.884
0.07
−14.2
0.007
Naphthalene
0.2816
0.779
0.073
−10.9
0.012
Naphthacene
Inner
0.2945
0.774
0.063
−13.8
0.011
Chrysene
Inner
0.3574
0.553
0.052
−8.2
0.019
Anthracene
Outer
0.3859
0.517
0.059
−8.7
0.024
Phenanthrene
Inner
0.4026
0.402
0.053
−6.8
0.025
Triphenylene
Inner
0.4306
0.067
0.025
−2.6
0.027
Naphthacene
Outer
0.4417
0.325
0.051
−6.7
0.031
Cyclohexane
Chair
0.7408
−4.34
0.007
−2.1
0.091
See Scheme 3.2 for the structures of these molecules
3 Localization-Delocalization Matrices and Electron Density …
75
being generally associated with the hydrogen atoms. This observation provides a
route to reducing the high-dimensional complexity of the LDM to provide a set of
molecular descriptors for building quantitative structure property relationships
(QSPR) or quantitative structure activity relationships (QSAR).
One of us (RC) has begun to explore the use of Principal Component Analysis
(PCA) [74] to reduce the dimensions of the LDM and extract information from it to
build robust QSPRs and QSARs. In the PCA approach, a matrix containing entries
that may be statistically correlated is converted to an eigenvector, devoid of such
correlation between variables, composed of what is termed the “principal components (PCs)”. The PCs may be equal in number to the original variables or can be
lesser. The first PC is the one with maximal variance followed by PCs that maximize the variance subject to the constraint of being orthogonal to all previous PCs.
The PCs are, thus, orthogonal (and uncorrelated) by construction and represent
the eigenvectors of the (symmetric) covariance matrix. Each of these eigenvectors
can be thought of as one of n-axes of an n-D ellipse. Axes of this ellipse that are
small mean that the corresponding variance along that axis is also small. We can
then neglect axes smaller than a given threshold (and its corresponding PC) from
the representation of the LDM without losing much information.
As mentioned above we have observed that there is a strong correlation between
the eigenvalues of the LDM and the number of electrons in the atom basins. The
hydrogen atoms have the smallest number of electrons and therefore within the
dimensionality reducing transformations of the PCA, we will be able to effectively
ignore their contributions to the eigenvalues extracted from the LDM by the PCA
transformation. Functionally, this is equivalent to the hydrogen suppressed structure
used by Kier and Hall to develop their “Atom Level Electrotopological State” [75].
Table 3.2 Aromatic rings sorted in order of their dissimilarity to benzene as measured by the
Frobenius distance and four corresponding common indices of aromaticity
Molecule
Ring
d Frob
HOMA
PDI
NICS(0)
FLU
Benzene
0
1.001
0.105
−11.5
0
Triphenylene
Outer
0.1634
0.93
0.086
−10.6
0.003
Phenanthrene
Outer
0.1991
0.902
0.082
−11.4
0.005
Chrysene
Outer
0.2301
0.859
0.079
−11.1
0.008
Anthracene
Inner
0.2420
0.884
0.07
−14.2
0.007
Naphthalene
0.2816
0.779
0.073
−10.9
0.012
Naphthacene
Inner
0.2945
0.774
0.063
−13.8
0.011
Chrysene
Inner
0.3574
0.553
0.052
−8.2
0.019
Anthracene
Outer
0.3859
0.517
0.059
−8.7
0.024
Phenanthrene
Inner
0.4026
0.402
0.053
−6.8
0.025
Triphenylene
Inner
0.4306
0.067
0.025
−2.6
0.027
Naphthacene
Outer
0.4417
0.325
0.051
−6.7
0.031
Cyclohexane
Chair
0.7408
−4.34
0.007
−2.1
0.091
See Scheme 3.2 for the structures of these molecules
3 Localization-Delocalization Matrices and Electron Density …
75