

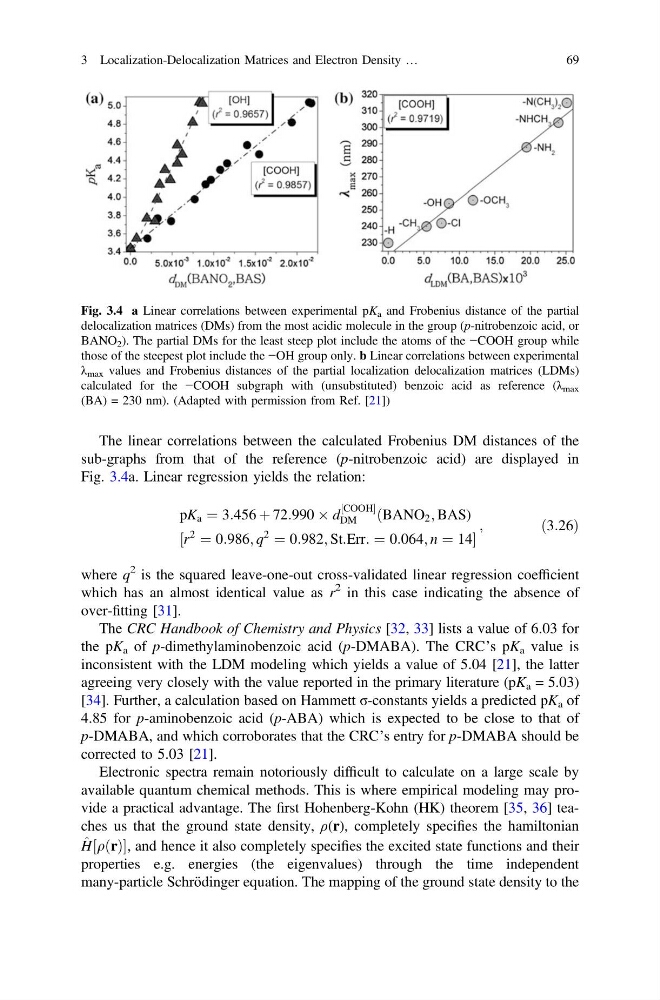
The linear correlations between the calculated Frobenius DM distances of the
sub-graphs from that of the reference (p-nitrobenzoic acid) are displayed in
Fig. 3.4a. Linear regression yields the relation:
pK a ¼ 3:456 þ 72:990 Â d
½COOH
DM
ðBANO 2 ; BAS)
½r
2
¼ 0:986; q
2
¼ 0:982; St:Err: ¼ 0:064; n ¼ 14
;
ð3:26Þ
where q
2 is the squared leave-one-out cross-validated linear regression coefficient
which has an almost identical value as r
2 in this case indicating the absence of
over-fitting [31].
The CRC Handbook of Chemistry and Physics [32, 33] lists a value of 6.03 for
the pK a of p-dimethylaminobenzoic acid (p-DMABA). The CRC’s pK a value is
inconsistent with the LDM modeling which yields a value of 5.04 [21], the latter
agreeing very closely with the value reported in the primary literature (pK a = 5.03)
[34]. Further, a calculation based on Hammett σ-constants yields a predicted pK a of
4.85 for p-aminobenzoic acid (p-ABA) which is expected to be close to that of
p-DMABA, and which corroborates that the CRC’s entry for p-DMABA should be
corrected to 5.03 [21].
Electronic spectra remain notoriously difficult to calculate on a large scale by
available quantum chemical methods. This is where empirical modeling may provide a practical advantage. The first Hohenberg-Kohn (HK) theorem [35, 36] teaches us that the ground state density, ρ(r), completely specifies the hamiltonian
^
H½qðrÞ, and hence it also completely specifies the excited state functions and their
properties e.g. energies (the eigenvalues) through the time independent
many-particle Schrödinger equation. The mapping of the ground state density to the
Fig. 3.4 a Linear correlations between experimental pK a and Frobenius distance of the partial
delocalization matrices (DMs) from the most acidic molecule in the group (p-nitrobenzoic acid, or
BANO 2 ). The partial DMs for the least steep plot include the atoms of the −COOH group while
those of the steepest plot include the −OH group only. b Linear correlations between experimental
λ max values and Frobenius distances of the partial localization delocalization matrices (LDMs)
calculated for the −COOH subgraph with (unsubstituted) benzoic acid as reference (λ max
(BA) = 230 nm). (Adapted with permission from Ref. [21])
3 Localization-Delocalization Matrices and Electron Density …
69
sub-graphs from that of the reference (p-nitrobenzoic acid) are displayed in
Fig. 3.4a. Linear regression yields the relation:
pK a ¼ 3:456 þ 72:990 Â d
½COOH
DM
ðBANO 2 ; BAS)
½r
2
¼ 0:986; q
2
¼ 0:982; St:Err: ¼ 0:064; n ¼ 14
;
ð3:26Þ
where q
2 is the squared leave-one-out cross-validated linear regression coefficient
which has an almost identical value as r
2 in this case indicating the absence of
over-fitting [31].
The CRC Handbook of Chemistry and Physics [32, 33] lists a value of 6.03 for
the pK a of p-dimethylaminobenzoic acid (p-DMABA). The CRC’s pK a value is
inconsistent with the LDM modeling which yields a value of 5.04 [21], the latter
agreeing very closely with the value reported in the primary literature (pK a = 5.03)
[34]. Further, a calculation based on Hammett σ-constants yields a predicted pK a of
4.85 for p-aminobenzoic acid (p-ABA) which is expected to be close to that of
p-DMABA, and which corroborates that the CRC’s entry for p-DMABA should be
corrected to 5.03 [21].
Electronic spectra remain notoriously difficult to calculate on a large scale by
available quantum chemical methods. This is where empirical modeling may provide a practical advantage. The first Hohenberg-Kohn (HK) theorem [35, 36] teaches us that the ground state density, ρ(r), completely specifies the hamiltonian
^
H½qðrÞ, and hence it also completely specifies the excited state functions and their
properties e.g. energies (the eigenvalues) through the time independent
many-particle Schrödinger equation. The mapping of the ground state density to the
Fig. 3.4 a Linear correlations between experimental pK a and Frobenius distance of the partial
delocalization matrices (DMs) from the most acidic molecule in the group (p-nitrobenzoic acid, or
BANO 2 ). The partial DMs for the least steep plot include the atoms of the −COOH group while
those of the steepest plot include the −OH group only. b Linear correlations between experimental
λ max values and Frobenius distances of the partial localization delocalization matrices (LDMs)
calculated for the −COOH subgraph with (unsubstituted) benzoic acid as reference (λ max
(BA) = 230 nm). (Adapted with permission from Ref. [21])
3 Localization-Delocalization Matrices and Electron Density …
69