

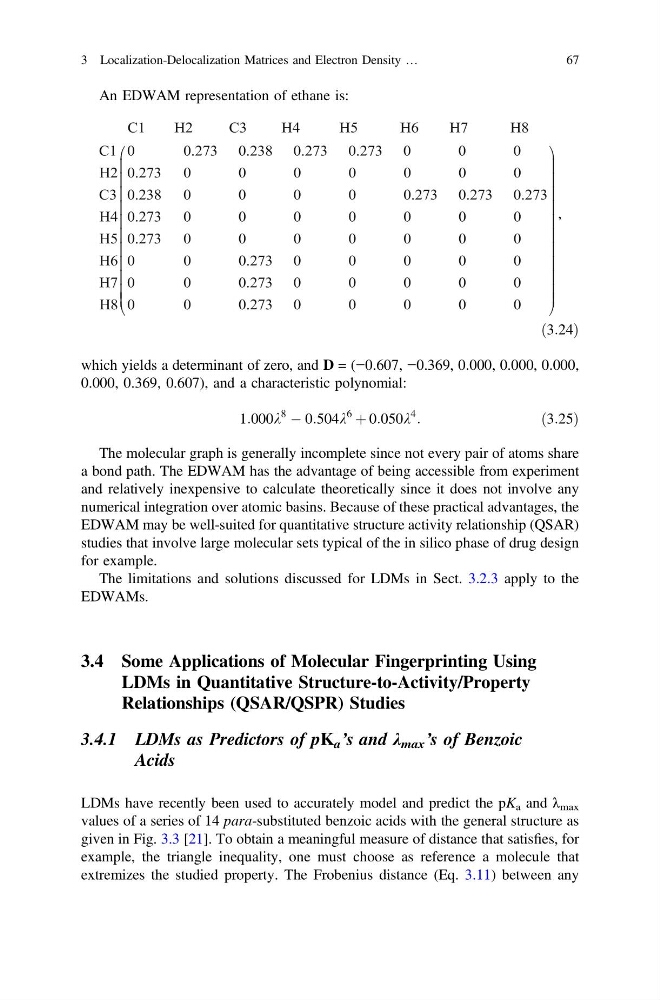
An EDWAM representation of ethane is:
ð3:24Þ
which yields a determinant of zero, and D = (−0.607, −0.369, 0.000, 0.000, 0.000,
0.000, 0.369, 0.607), and a characteristic polynomial:
1:000k
8
À 0:504k
6
þ 0:050k
4
:
ð3:25Þ
The molecular graph is generally incomplete since not every pair of atoms share
a bond path. The EDWAM has the advantage of being accessible from experiment
and relatively inexpensive to calculate theoretically since it does not involve any
numerical integration over atomic basins. Because of these practical advantages, the
EDWAM may be well-suited for quantitative structure activity relationship (QSAR)
studies that involve large molecular sets typical of the in silico phase of drug design
for example.
The limitations and solutions discussed for LDMs in Sect. 3.2.3 apply to the
EDWAMs.
3.4 Some Applications of Molecular Fingerprinting Using
LDMs in Quantitative Structure-to-Activity/Property
Relationships (QSAR/QSPR) Studies
3.4.1 LDMs as Predictors of pK a ’s and λ max ’s of Benzoic
Acids
LDMs have recently been used to accurately model and predict the pK a and λ max
values of a series of 14 para-substituted benzoic acids with the general structure as
given in Fig. 3.3 [21]. To obtain a meaningful measure of distance that satisfies, for
example, the triangle inequality, one must choose as reference a molecule that
extremizes the studied property. The Frobenius distance (Eq. 3.11) between any
3 Localization-Delocalization Matrices and Electron Density …
67
ð3:24Þ
which yields a determinant of zero, and D = (−0.607, −0.369, 0.000, 0.000, 0.000,
0.000, 0.369, 0.607), and a characteristic polynomial:
1:000k
8
À 0:504k
6
þ 0:050k
4
:
ð3:25Þ
The molecular graph is generally incomplete since not every pair of atoms share
a bond path. The EDWAM has the advantage of being accessible from experiment
and relatively inexpensive to calculate theoretically since it does not involve any
numerical integration over atomic basins. Because of these practical advantages, the
EDWAM may be well-suited for quantitative structure activity relationship (QSAR)
studies that involve large molecular sets typical of the in silico phase of drug design
for example.
The limitations and solutions discussed for LDMs in Sect. 3.2.3 apply to the
EDWAMs.
3.4 Some Applications of Molecular Fingerprinting Using
LDMs in Quantitative Structure-to-Activity/Property
Relationships (QSAR/QSPR) Studies
3.4.1 LDMs as Predictors of pK a ’s and λ max ’s of Benzoic
Acids
LDMs have recently been used to accurately model and predict the pK a and λ max
values of a series of 14 para-substituted benzoic acids with the general structure as
given in Fig. 3.3 [21]. To obtain a meaningful measure of distance that satisfies, for
example, the triangle inequality, one must choose as reference a molecule that
extremizes the studied property. The Frobenius distance (Eq. 3.11) between any
3 Localization-Delocalization Matrices and Electron Density …
67