

pairs of bonded atoms. A BCP is also used in tracing its associated bond path which
is a unique line of maximal electron density that links the nuclei of two bonded
atoms [13–15] and which characterizes the nature and strength of chemical bonding
[16].
The bond path is always found to be accompanied by a shadow graph, the virial
path, first discovered by Keith, Bader, and Aray [17]. The virial path is a line of
maximally-negative potential energy density in three-dimensional space that links
the same pair of atoms that share a bond path and an interatomic surface of
zero-flux. No theoretical basis has ever been provided that requires the presence of
a virial path as a doppelganger of every bond path that links two chemically bonded
atoms, however, there is no known computational violation of this observation to
date known to the authors. The presence of the virial path links the concept of
chemical bonding directly with the concept of energetic stability as amply discussed
in literature on QTAIM.
The partitioning of the space into separate non-overlapping atomic basins,
exhausting all three-dimensional space, entails the definition of “atomic properties”
that add-up to yield the corresponding molecular counterparts. Such atomic properties are obtained by integrating each corresponding property density over the
bounded region of real space occupied by the atomic basin.
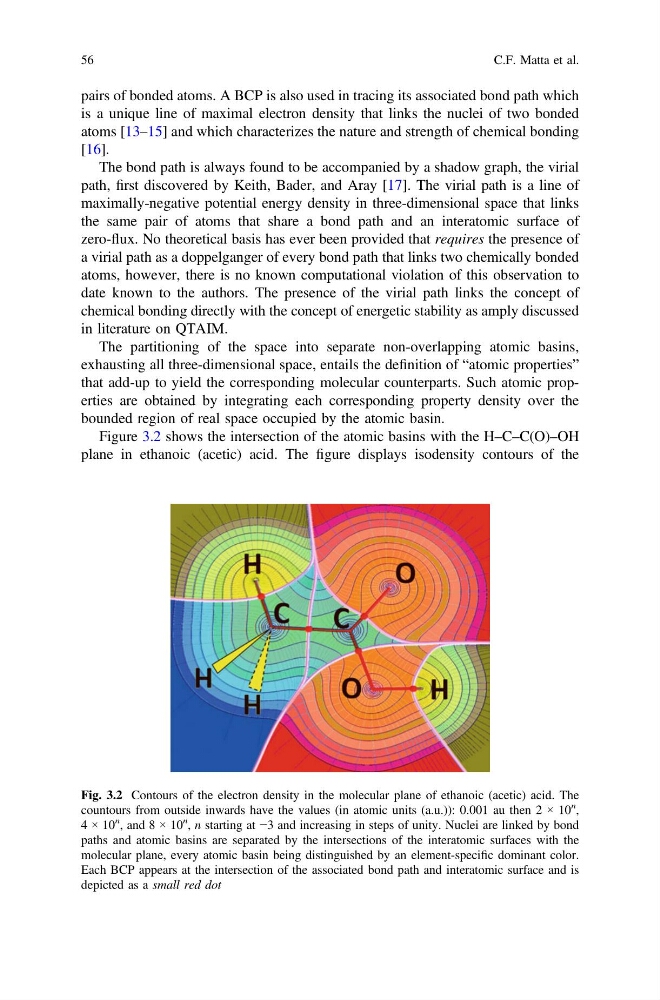
Figure 3.2 shows the intersection of the atomic basins with the H–C–C(O)–OH
plane in ethanoic (acetic) acid. The figure displays isodensity contours of the
Fig. 3.2 Contours of the electron density in the molecular plane of ethanoic (acetic) acid. The
countours from outside inwards have the values (in atomic units (a.u.)): 0.001 au then 2 × 10
n
,
4 × 10
n
, and 8 × 10
n
, n starting at −3 and increasing in steps of unity. Nuclei are linked by bond
paths and atomic basins are separated by the intersections of the interatomic surfaces with the
molecular plane, every atomic basin being distinguished by an element-specific dominant color.
Each BCP appears at the intersection of the associated bond path and interatomic surface and is
depicted as a small red dot
56
C.F. Matta et al.
is a unique line of maximal electron density that links the nuclei of two bonded
atoms [13–15] and which characterizes the nature and strength of chemical bonding
[16].
The bond path is always found to be accompanied by a shadow graph, the virial
path, first discovered by Keith, Bader, and Aray [17]. The virial path is a line of
maximally-negative potential energy density in three-dimensional space that links
the same pair of atoms that share a bond path and an interatomic surface of
zero-flux. No theoretical basis has ever been provided that requires the presence of
a virial path as a doppelganger of every bond path that links two chemically bonded
atoms, however, there is no known computational violation of this observation to
date known to the authors. The presence of the virial path links the concept of
chemical bonding directly with the concept of energetic stability as amply discussed
in literature on QTAIM.
The partitioning of the space into separate non-overlapping atomic basins,
exhausting all three-dimensional space, entails the definition of “atomic properties”
that add-up to yield the corresponding molecular counterparts. Such atomic properties are obtained by integrating each corresponding property density over the
bounded region of real space occupied by the atomic basin.
Figure 3.2 shows the intersection of the atomic basins with the H–C–C(O)–OH
plane in ethanoic (acetic) acid. The figure displays isodensity contours of the
Fig. 3.2 Contours of the electron density in the molecular plane of ethanoic (acetic) acid. The
countours from outside inwards have the values (in atomic units (a.u.)): 0.001 au then 2 × 10
n
,
4 × 10
n
, and 8 × 10
n
, n starting at −3 and increasing in steps of unity. Nuclei are linked by bond
paths and atomic basins are separated by the intersections of the interatomic surfaces with the
molecular plane, every atomic basin being distinguished by an element-specific dominant color.
Each BCP appears at the intersection of the associated bond path and interatomic surface and is
depicted as a small red dot
56
C.F. Matta et al.