

t-butylethylene, and this statistical difference amounts to an entropic contribution to
ΔG
0 . Equation 7 summarizes how these terms combine for any two hydrocarbons to
give the relative metal–carbon bond strength, D rel (Rh–C), from the free energy of
reaction:
D rel Rh À C
ð
Þ¼ΔG
0
À D R2ÀH À D R1ÀH
½
À RTln #H 2 =#H 1
ð
Þ
ð 7Þ
This analysis can be applied to all of the hydrocarbon activations discussed thus
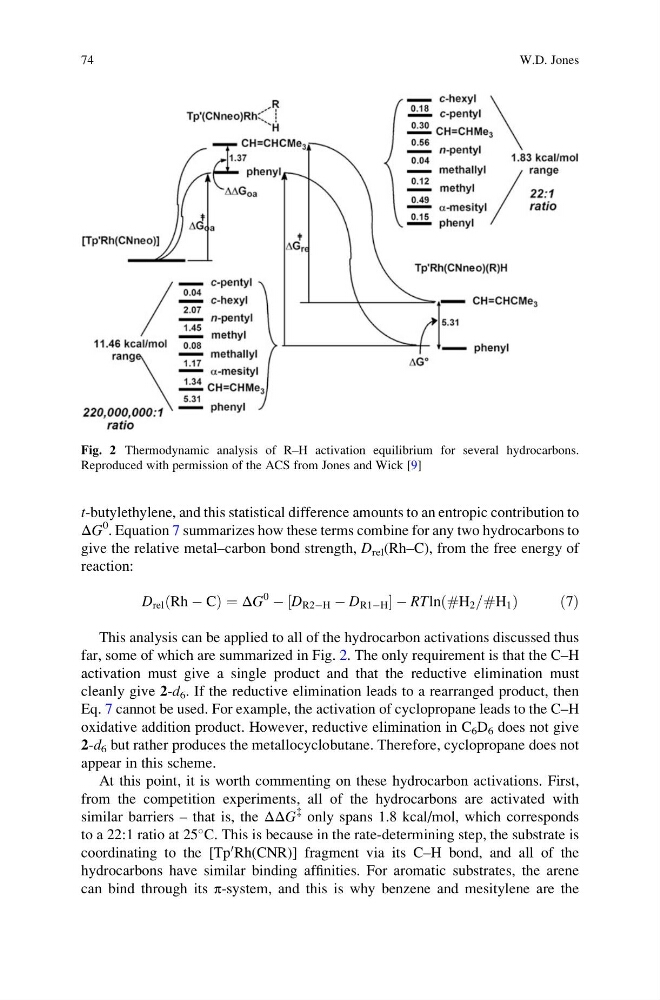
far, some of which are summarized in Fig. 2. The only requirement is that the C–H
activation must give a single product and that the reductive elimination must
cleanly give 2-d 6 . If the reductive elimination leads to a rearranged product, then
Eq. 7 cannot be used. For example, the activation of cyclopropane leads to the C–H
oxidative addition product. However, reductive elimination in C 6 D 6 does not give
2-d 6 but rather produces the metallocyclobutane. Therefore, cyclopropane does not
appear in this scheme.
At this point, it is worth commenting on these hydrocarbon activations. First,
from the competition experiments, all of the hydrocarbons are activated with
similar barriers – that is, the ΔΔG
{ only spans 1.8 kcal/mol, which corresponds
to a 22:1 ratio at 25
C. This is because in the rate-determining step, the substrate is
coordinating to the [Tp
0 Rh(CNR)] fragment via its C–H bond, and all of the
hydrocarbons have similar binding affinities. For aromatic substrates, the arene
can bind through its π-system, and this is why benzene and mesitylene are the
Fig. 2 Thermodynamic analysis of R–H activation equilibrium for several hydrocarbons.
Reproduced with permission of the ACS from Jones and Wick [9]
74
W.D. Jones
ΔG
0 . Equation 7 summarizes how these terms combine for any two hydrocarbons to
give the relative metal–carbon bond strength, D rel (Rh–C), from the free energy of
reaction:
D rel Rh À C
ð
Þ¼ΔG
0
À D R2ÀH À D R1ÀH
½
À RTln #H 2 =#H 1
ð
Þ
ð 7Þ
This analysis can be applied to all of the hydrocarbon activations discussed thus
far, some of which are summarized in Fig. 2. The only requirement is that the C–H
activation must give a single product and that the reductive elimination must
cleanly give 2-d 6 . If the reductive elimination leads to a rearranged product, then
Eq. 7 cannot be used. For example, the activation of cyclopropane leads to the C–H
oxidative addition product. However, reductive elimination in C 6 D 6 does not give
2-d 6 but rather produces the metallocyclobutane. Therefore, cyclopropane does not
appear in this scheme.
At this point, it is worth commenting on these hydrocarbon activations. First,
from the competition experiments, all of the hydrocarbons are activated with
similar barriers – that is, the ΔΔG
{ only spans 1.8 kcal/mol, which corresponds
to a 22:1 ratio at 25
C. This is because in the rate-determining step, the substrate is
coordinating to the [Tp
0 Rh(CNR)] fragment via its C–H bond, and all of the
hydrocarbons have similar binding affinities. For aromatic substrates, the arene
can bind through its π-system, and this is why benzene and mesitylene are the
Fig. 2 Thermodynamic analysis of R–H activation equilibrium for several hydrocarbons.
Reproduced with permission of the ACS from Jones and Wick [9]
74
W.D. Jones