

473
14 Quantitative Structure-Property Relationship Analysis …
where N is the number of conformers being considered.
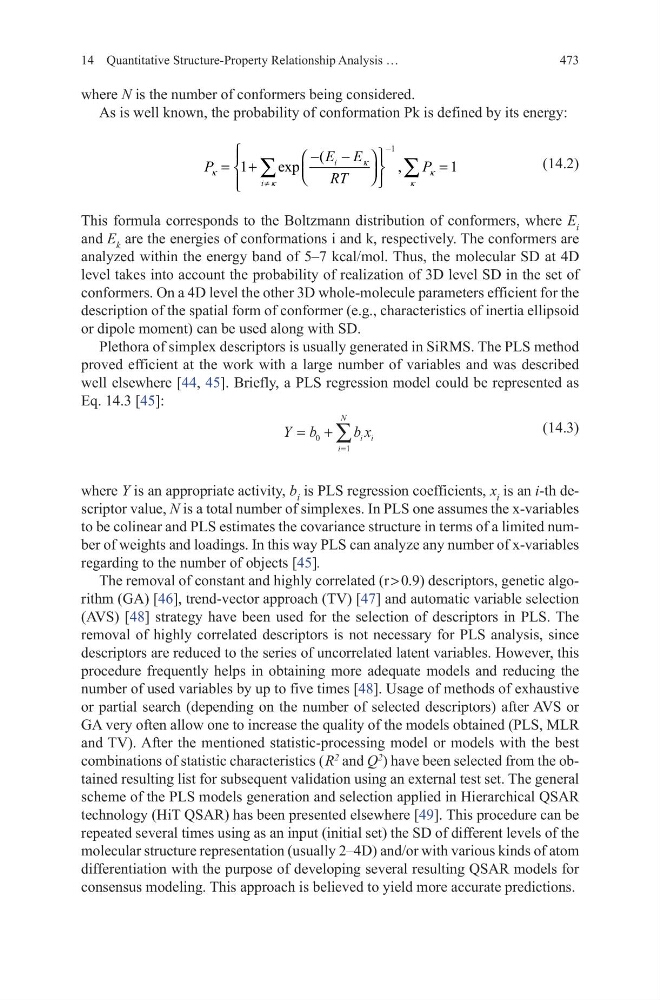
As is well known, the probability of conformation Pk is defined by its energy:
(14.2)
This formula corresponds to the Boltzmann distribution of conformers, where E i
and E k are the energies of conformations i and k, respectively. The conformers are
analyzed within the energy band of 5–7 kcal/mol. Thus, the molecular SD at 4D
level takes into account the probability of realization of 3D level SD in the set of
conformers. On a 4D level the other 3D whole-molecule parameters efficient for the
description of the spatial form of conformer (e.g., characteristics of inertia ellipsoid
or dipole moment) can be used along with SD.
Plethora of simplex descriptors is usually generated in SiRMS. The PLS method
proved efficient at the work with a large number of variables and was described
well elsewhere [44, 45]. Briefly, a PLS regression model could be represented as
Eq. 14.3 [45]:
(14.3)
where Y is an appropriate activity, b i is PLS regression coefficients, x i is an i-th descriptor value, N is a total number of simplexes. In PLS one assumes the x-variables
to be colinear and PLS estimates the covariance structure in terms of a limited number of weights and loadings. In this way PLS can analyze any number of x-variables
regarding to the number of objects [45].
The removal of constant and highly correlated (r > 0.9) descriptors, genetic algorithm (GA) [46], trend-vector approach (TV) [47] and automatic variable selection
(AVS) [48] strategy have been used for the selection of descriptors in PLS. The
removal of highly correlated descriptors is not necessary for PLS analysis, since
descriptors are reduced to the series of uncorrelated latent variables. However, this
procedure frequently helps in obtaining more adequate models and reducing the
number of used variables by up to five times [48]. Usage of methods of exhaustive
or partial search (depending on the number of selected descriptors) after AVS or
GA very often allow one to increase the quality of the models obtained (PLS, MLR
and TV). After the mentioned statistic-processing model or models with the best
combinations of statistic characteristics ( R
2
and Q
2
) have been selected from the obtained resulting list for subsequent validation using an external test set. The general
scheme of the PLS models generation and selection applied in Hierarchical QSAR
technology (HiT QSAR) has been presented elsewhere [49]. This procedure can be
repeated several times using as an input (initial set) the SD of different levels of the
molecular structure representation (usually 2–4D) and/or with various kinds of atom
differentiation with the purpose of developing several resulting QSAR models for
consensus modeling. This approach is believed to yield more accurate predictions.
1
(
1
exp
,
1
κ
κ
κ
κ
κ
-
≠
-
-
= +
=
∑
∑
i
i
E E
P
P
RT
Y b
b x
i i
i
N
= +
=
∑
0
1
14 Quantitative Structure-Property Relationship Analysis …
where N is the number of conformers being considered.
As is well known, the probability of conformation Pk is defined by its energy:
(14.2)
This formula corresponds to the Boltzmann distribution of conformers, where E i
and E k are the energies of conformations i and k, respectively. The conformers are
analyzed within the energy band of 5–7 kcal/mol. Thus, the molecular SD at 4D
level takes into account the probability of realization of 3D level SD in the set of
conformers. On a 4D level the other 3D whole-molecule parameters efficient for the
description of the spatial form of conformer (e.g., characteristics of inertia ellipsoid
or dipole moment) can be used along with SD.
Plethora of simplex descriptors is usually generated in SiRMS. The PLS method
proved efficient at the work with a large number of variables and was described
well elsewhere [44, 45]. Briefly, a PLS regression model could be represented as
Eq. 14.3 [45]:
(14.3)
where Y is an appropriate activity, b i is PLS regression coefficients, x i is an i-th descriptor value, N is a total number of simplexes. In PLS one assumes the x-variables
to be colinear and PLS estimates the covariance structure in terms of a limited number of weights and loadings. In this way PLS can analyze any number of x-variables
regarding to the number of objects [45].
The removal of constant and highly correlated (r > 0.9) descriptors, genetic algorithm (GA) [46], trend-vector approach (TV) [47] and automatic variable selection
(AVS) [48] strategy have been used for the selection of descriptors in PLS. The
removal of highly correlated descriptors is not necessary for PLS analysis, since
descriptors are reduced to the series of uncorrelated latent variables. However, this
procedure frequently helps in obtaining more adequate models and reducing the
number of used variables by up to five times [48]. Usage of methods of exhaustive
or partial search (depending on the number of selected descriptors) after AVS or
GA very often allow one to increase the quality of the models obtained (PLS, MLR
and TV). After the mentioned statistic-processing model or models with the best
combinations of statistic characteristics ( R
2
and Q
2
) have been selected from the obtained resulting list for subsequent validation using an external test set. The general
scheme of the PLS models generation and selection applied in Hierarchical QSAR
technology (HiT QSAR) has been presented elsewhere [49]. This procedure can be
repeated several times using as an input (initial set) the SD of different levels of the
molecular structure representation (usually 2–4D) and/or with various kinds of atom
differentiation with the purpose of developing several resulting QSAR models for
consensus modeling. This approach is believed to yield more accurate predictions.
1
(
1
exp
,
1
κ
κ
κ
κ
κ
-
≠
-
-
= +
=
∑
∑
i
i
E E
P
P
RT
Y b
b x
i i
i
N
= +
=
∑
0
1