

422
P. M. Vassiliev et al.
As in the case with Gymnema sylvestre extract, the IT Microcosm prediction of
the hypoglycemic activity of these mixtures was made with the normal strategy on
a training set of known hypoglycemic substances. The membership function in the
class of hypoglycemic compounds served as the evaluation metric of the extent of
activity.
Spearman’s rank correlation coefficient R S between the synergistic-effect value
and the membership-function values was calculated, and the value R S = 0.8169 was
achieved, which corresponds to statistical significance p = 7.192·10
−3
. Consequently,
Table 12.20 Experimental clinical indices and predictive estimates of the hypoglycemic activity
synergism of antidiabetic drug combinations
Drug (1 mol) Metformin,
mol
Number of
patients
Duration,
weeks
Synergism, %
a
Fb Dist
b
Nateglinide
10
701
24
55
0.8244
Rosiglitazone 865
328
26
75
0.9974
Glibenclamide 765
806
20
39
0.9132
Glibenclamide 383
411
16
14
0.9131
Rosiglitazone 346
468
32
109
0.9975
Vildagliptin
23
1179
24
64
0.9132
Vildagliptin
47
1179
24
14
0.9131
Sitagliptin
32
1250
18
218
0.9999
Sitagliptin
63
1250
18
129
0.9999
a
An average increase in the hypoglycemic activity of a combination of two drugs compared with
Metformin perper se, according to clinical study data
b
The membership function (20) in the class of hypoglycemic compounds in predicting with the
normal strategy by the distance method
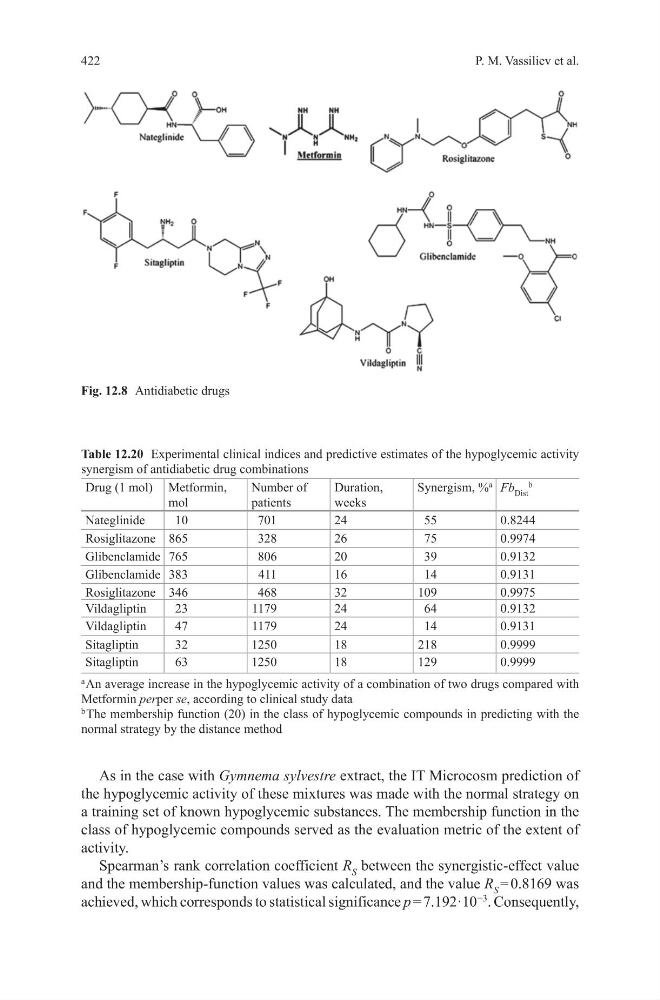
Fig. 12.8 Antidiabetic drugs
P. M. Vassiliev et al.
As in the case with Gymnema sylvestre extract, the IT Microcosm prediction of
the hypoglycemic activity of these mixtures was made with the normal strategy on
a training set of known hypoglycemic substances. The membership function in the
class of hypoglycemic compounds served as the evaluation metric of the extent of
activity.
Spearman’s rank correlation coefficient R S between the synergistic-effect value
and the membership-function values was calculated, and the value R S = 0.8169 was
achieved, which corresponds to statistical significance p = 7.192·10
−3
. Consequently,
Table 12.20 Experimental clinical indices and predictive estimates of the hypoglycemic activity
synergism of antidiabetic drug combinations
Drug (1 mol) Metformin,
mol
Number of
patients
Duration,
weeks
Synergism, %
a
Fb Dist
b
Nateglinide
10
701
24
55
0.8244
Rosiglitazone 865
328
26
75
0.9974
Glibenclamide 765
806
20
39
0.9132
Glibenclamide 383
411
16
14
0.9131
Rosiglitazone 346
468
32
109
0.9975
Vildagliptin
23
1179
24
64
0.9132
Vildagliptin
47
1179
24
14
0.9131
Sitagliptin
32
1250
18
218
0.9999
Sitagliptin
63
1250
18
129
0.9999
a
An average increase in the hypoglycemic activity of a combination of two drugs compared with
Metformin perper se, according to clinical study data
b
The membership function (20) in the class of hypoglycemic compounds in predicting with the
normal strategy by the distance method
Fig. 12.8 Antidiabetic drugs