

391
12 Consensus Drug Design Using IT Microcosm
Prediction Accuracy Metrics. In all testing methods, the following indicators are
worked out (and measured as percentages):
F 0 the proportion of correctly classified compounds irrespective of the activity
class (accuracy);
F a the proportion of correctly classified active compounds (sensitivity);
F n the proportion of correctly classified inactive compounds (specificity); and
F u the proportion of compounds that were rejected from prediction (this is only
calculated in the conservative strategy).
12.2.6 Noncontradiction Check of the Prediction
Substances that showed the coincidence of two or three calculated estimates of activity obtained with different strategies are of the greatest interest for experimental
study because in this case we take into consideration both standard and nonstandard
QSAR regularities and the novelty of the chemical structure; the reliability and adequacy of the predictions are therefore greatly increased.
When selecting such structures, IT Microcosm allows a noncontradiction check
of the prediction estimate spectrum in case of semiquantitative gradations of activity [102]. Each activity level is matched to a set of correct evaluations of other
activity levels referred to as a template. For example, if the activity can be scored
as “high,” “moderate,” “low,” “high or moderate,” “active,” and “inactive,” the
template set appears as ANNAAN, NANAAN, NNANAN, AANAAN, AAAAAN,
NNNNNA. If one decision rule assigns a compound to the “high” class, the classification of this compound as “moderate”, “low” or “inactive” in other decision
rules is logically incorrect.
According to the prediction results, we select compounds that received an “A”
score for the target level (type) of activity in at least one strategy. In this case, for
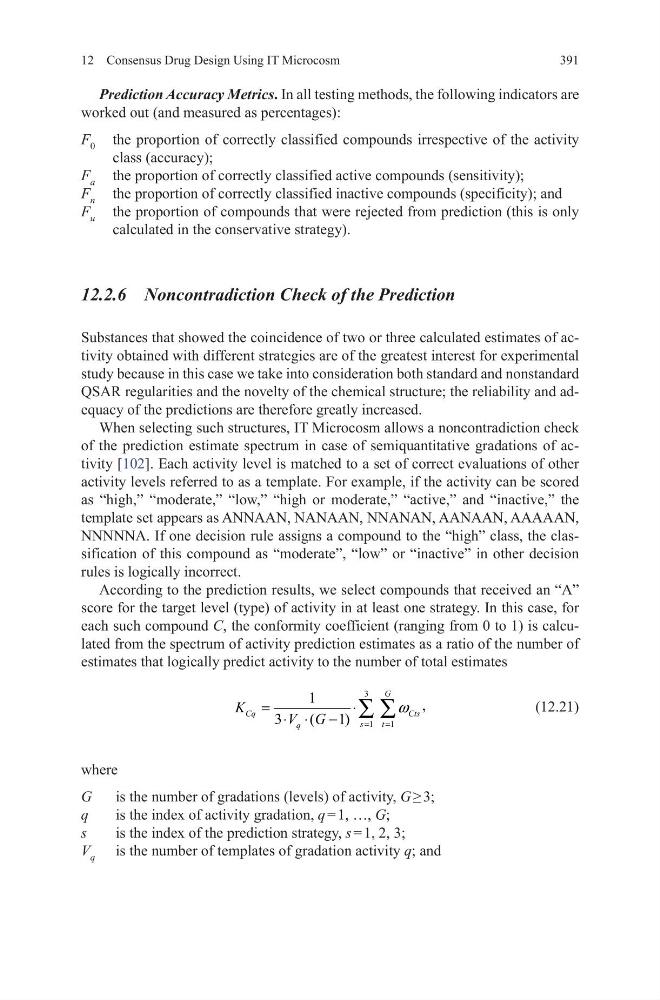
each such compound C, the conformity coefficient (ranging from 0 to 1) is calculated from the spectrum of activity prediction estimates as a ratio of the number of
estimates that logically predict activity to the number of total estimates
(12.21)
where
G
is the number of gradations (levels) of activity, G ≥ 3;
q
is the index of activity gradation, q = 1, …, G;
s
is the index of the prediction strategy, s = 1, 2, 3;
V q is the number of templates of gradation activity q; and
3
1
1
1
,
3
(
1)
G
Cq
Cts
s
t
q
K
V G
ω
=
=
=
⋅
⋅ ⋅ -
∑ ∑
12 Consensus Drug Design Using IT Microcosm
Prediction Accuracy Metrics. In all testing methods, the following indicators are
worked out (and measured as percentages):
F 0 the proportion of correctly classified compounds irrespective of the activity
class (accuracy);
F a the proportion of correctly classified active compounds (sensitivity);
F n the proportion of correctly classified inactive compounds (specificity); and
F u the proportion of compounds that were rejected from prediction (this is only
calculated in the conservative strategy).
12.2.6 Noncontradiction Check of the Prediction
Substances that showed the coincidence of two or three calculated estimates of activity obtained with different strategies are of the greatest interest for experimental
study because in this case we take into consideration both standard and nonstandard
QSAR regularities and the novelty of the chemical structure; the reliability and adequacy of the predictions are therefore greatly increased.
When selecting such structures, IT Microcosm allows a noncontradiction check
of the prediction estimate spectrum in case of semiquantitative gradations of activity [102]. Each activity level is matched to a set of correct evaluations of other
activity levels referred to as a template. For example, if the activity can be scored
as “high,” “moderate,” “low,” “high or moderate,” “active,” and “inactive,” the
template set appears as ANNAAN, NANAAN, NNANAN, AANAAN, AAAAAN,
NNNNNA. If one decision rule assigns a compound to the “high” class, the classification of this compound as “moderate”, “low” or “inactive” in other decision
rules is logically incorrect.
According to the prediction results, we select compounds that received an “A”
score for the target level (type) of activity in at least one strategy. In this case, for
each such compound C, the conformity coefficient (ranging from 0 to 1) is calculated from the spectrum of activity prediction estimates as a ratio of the number of
estimates that logically predict activity to the number of total estimates
(12.21)
where
G
is the number of gradations (levels) of activity, G ≥ 3;
q
is the index of activity gradation, q = 1, …, G;
s
is the index of the prediction strategy, s = 1, 2, 3;
V q is the number of templates of gradation activity q; and
3
1
1
1
,
3
(
1)
G
Cq
Cts
s
t
q
K
V G
ω
=
=
=
⋅
⋅ ⋅ -
∑ ∑