

24
2 Experimental and Theoretical Considerations
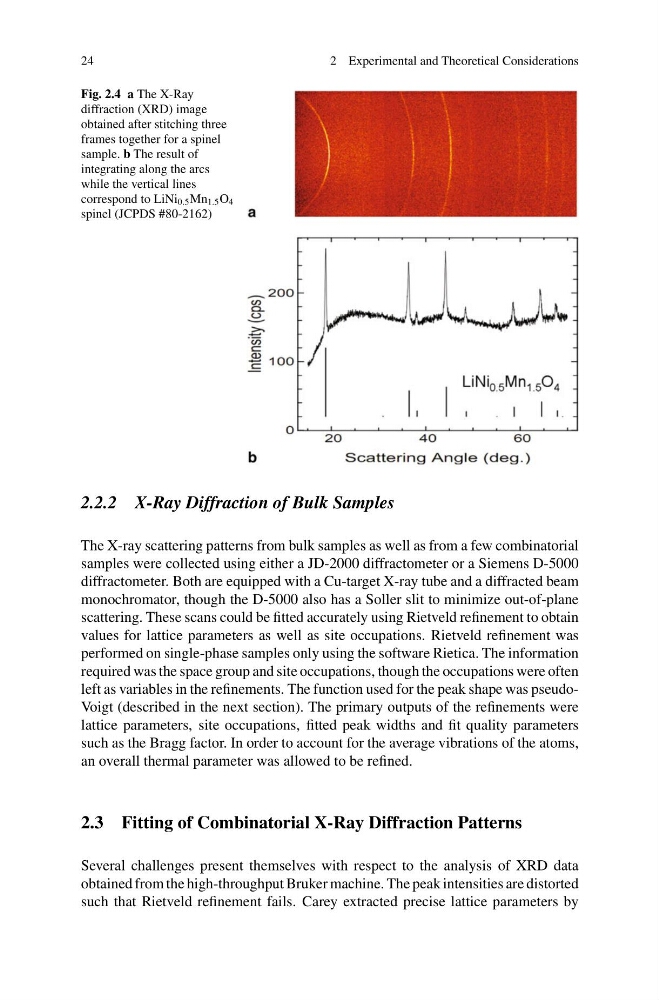
Fig. 2.4 a The X-Ray
diffraction (XRD) image
obtained after stitching three
frames together for a spinel
sample. b The result of
integrating along the arcs
while the vertical lines
correspond to LiNi 0.5 Mn 1.5 O 4
spinel (JCPDS #80-2162)
2.2.2 X-Ray Diffraction of Bulk Samples
The X-ray scattering patterns from bulk samples as well as from a few combinatorial
samples were collected using either a JD-2000 diffractometer or a Siemens D-5000
diffractometer. Both are equipped with a Cu-target X-ray tube and a diffracted beam
monochromator, though the D-5000 also has a Soller slit to minimize out-of-plane
scattering. These scans could be fitted accurately using Rietveld refinement to obtain
values for lattice parameters as well as site occupations. Rietveld refinement was
performed on single-phase samples only using the software Rietica. The information
required was the space group and site occupations, though the occupations were often
left as variables in the refinements. The function used for the peak shape was pseudoVoigt (described in the next section). The primary outputs of the refinements were
lattice parameters, site occupations, fitted peak widths and fit quality parameters
such as the Bragg factor. In order to account for the average vibrations of the atoms,
an overall thermal parameter was allowed to be refined.
2.3 Fitting of Combinatorial X-Ray Diffraction Patterns
Several challenges present themselves with respect to the analysis of XRD data
obtained from the high-throughput Bruker machine. The peak intensities are distorted
such that Rietveld refinement fails. Carey extracted precise lattice parameters by
2 Experimental and Theoretical Considerations
Fig. 2.4 a The X-Ray
diffraction (XRD) image
obtained after stitching three
frames together for a spinel
sample. b The result of
integrating along the arcs
while the vertical lines
correspond to LiNi 0.5 Mn 1.5 O 4
spinel (JCPDS #80-2162)
2.2.2 X-Ray Diffraction of Bulk Samples
The X-ray scattering patterns from bulk samples as well as from a few combinatorial
samples were collected using either a JD-2000 diffractometer or a Siemens D-5000
diffractometer. Both are equipped with a Cu-target X-ray tube and a diffracted beam
monochromator, though the D-5000 also has a Soller slit to minimize out-of-plane
scattering. These scans could be fitted accurately using Rietveld refinement to obtain
values for lattice parameters as well as site occupations. Rietveld refinement was
performed on single-phase samples only using the software Rietica. The information
required was the space group and site occupations, though the occupations were often
left as variables in the refinements. The function used for the peak shape was pseudoVoigt (described in the next section). The primary outputs of the refinements were
lattice parameters, site occupations, fitted peak widths and fit quality parameters
such as the Bragg factor. In order to account for the average vibrations of the atoms,
an overall thermal parameter was allowed to be refined.
2.3 Fitting of Combinatorial X-Ray Diffraction Patterns
Several challenges present themselves with respect to the analysis of XRD data
obtained from the high-throughput Bruker machine. The peak intensities are distorted
such that Rietveld refinement fails. Carey extracted precise lattice parameters by