

12
1 Introduction
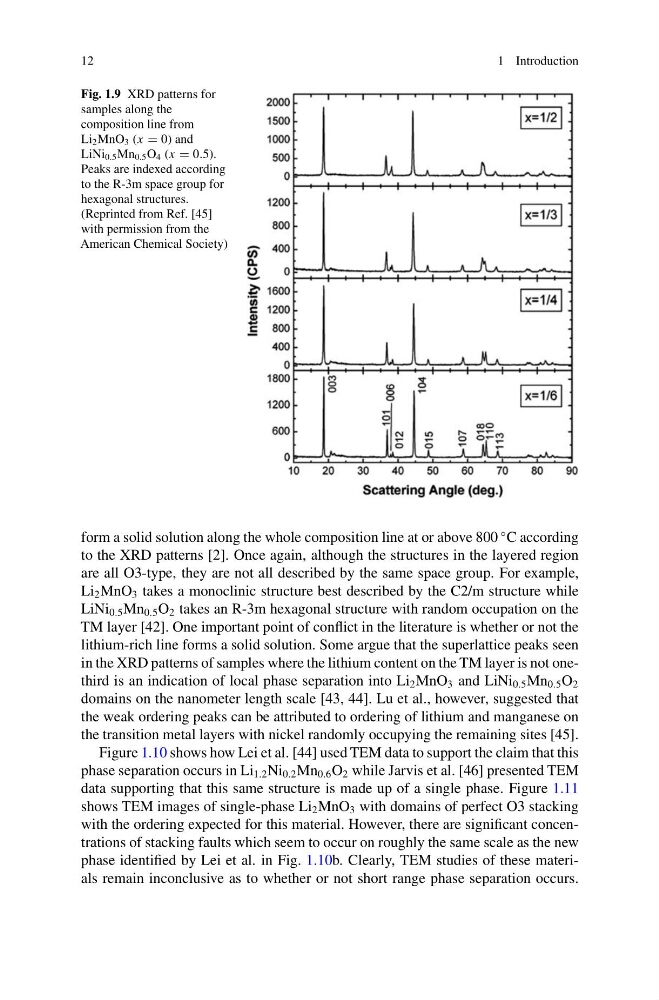
Fig. 1.9 XRD patterns for
samples along the
composition line from
Li 2 MnO 3 (x = 0) and
LiNi 0.5 Mn 0.5 O 4 (x = 0.5).
Peaks are indexed according
to the R-3m space group for
hexagonal structures.
(Reprinted from Ref. [45]
with permission from the
American Chemical Society)
form a solid solution along the whole composition line at or above 800
◦ C according
to the XRD patterns [2]. Once again, although the structures in the layered region
are all O3-type, they are not all described by the same space group. For example,
Li 2 MnO 3 takes a monoclinic structure best described by the C2/m structure while
LiNi 0.5 Mn 0.5 O 2 takes an R-3m hexagonal structure with random occupation on the
TM layer [42]. One important point of conflict in the literature is whether or not the
lithium-rich line forms a solid solution. Some argue that the superlattice peaks seen
in the XRD patterns of samples where the lithium content on the TM layer is not onethird is an indication of local phase separation into Li 2 MnO 3 and LiNi 0.5 Mn 0.5 O 2
domains on the nanometer length scale [43, 44]. Lu et al., however, suggested that
the weak ordering peaks can be attributed to ordering of lithium and manganese on
the transition metal layers with nickel randomly occupying the remaining sites [45].
Figure 1.10 shows how Lei et al. [44] used TEM data to support the claim that this
phase separation occurs in Li 1.2 Ni 0.2 Mn 0.6 O 2 while Jarvis et al. [46] presented TEM
data supporting that this same structure is made up of a single phase. Figure 1.11
shows TEM images of single-phase Li 2 MnO 3 with domains of perfect O3 stacking
with the ordering expected for this material. However, there are significant concentrations of stacking faults which seem to occur on roughly the same scale as the new
phase identified by Lei et al. in Fig. 1.10b. Clearly, TEM studies of these materials remain inconclusive as to whether or not short range phase separation occurs.
1 Introduction
Fig. 1.9 XRD patterns for
samples along the
composition line from
Li 2 MnO 3 (x = 0) and
LiNi 0.5 Mn 0.5 O 4 (x = 0.5).
Peaks are indexed according
to the R-3m space group for
hexagonal structures.
(Reprinted from Ref. [45]
with permission from the
American Chemical Society)
form a solid solution along the whole composition line at or above 800
◦ C according
to the XRD patterns [2]. Once again, although the structures in the layered region
are all O3-type, they are not all described by the same space group. For example,
Li 2 MnO 3 takes a monoclinic structure best described by the C2/m structure while
LiNi 0.5 Mn 0.5 O 2 takes an R-3m hexagonal structure with random occupation on the
TM layer [42]. One important point of conflict in the literature is whether or not the
lithium-rich line forms a solid solution. Some argue that the superlattice peaks seen
in the XRD patterns of samples where the lithium content on the TM layer is not onethird is an indication of local phase separation into Li 2 MnO 3 and LiNi 0.5 Mn 0.5 O 2
domains on the nanometer length scale [43, 44]. Lu et al., however, suggested that
the weak ordering peaks can be attributed to ordering of lithium and manganese on
the transition metal layers with nickel randomly occupying the remaining sites [45].
Figure 1.10 shows how Lei et al. [44] used TEM data to support the claim that this
phase separation occurs in Li 1.2 Ni 0.2 Mn 0.6 O 2 while Jarvis et al. [46] presented TEM
data supporting that this same structure is made up of a single phase. Figure 1.11
shows TEM images of single-phase Li 2 MnO 3 with domains of perfect O3 stacking
with the ordering expected for this material. However, there are significant concentrations of stacking faults which seem to occur on roughly the same scale as the new
phase identified by Lei et al. in Fig. 1.10b. Clearly, TEM studies of these materials remain inconclusive as to whether or not short range phase separation occurs.